![Stock Trading for Beginners [2023] | How to Buy Stocks](/cdn-cgi/image/format=auto,quality=85/https://assets.finbold.com/uploads/2021/09/Stock-Trading-for-Beginners-2023-_-How-to-Buy-Stocks-1.jpg)
In this guide, we will look at stock trading for beginners, delving into how to buy stocks, sell them, and analyze many of the features used when trading. In addition, we’ll go over:
- Stock-buying methods;
- Avoiding common stock trading mistakes;
- Selecting a suitable brokerage;
- What to look for when researching a stock;
- Budgeting;
- Executing trades;
- Portfolio-building recommendations and much more.
Best Crypto Exchange for Intermediate Traders and Investors
-
Invest in cryptocurrencies and 3,000+ other assets including stocks and precious metals.
-
0% commission on stocks - buy in bulk or just a fraction from as little as $10. Other fees apply. For more information, visit etoro.com/trading/fees.
-
Copy top-performing traders in real time, automatically.
-
eToro USA is registered with FINRA for securities trading.
For this reason, we’ll take away the intimidating side of trading and teach you how to get started showing you how to trade stocks in order to optimize your profits while reducing your costs.
Lastly, this guide will primarily focus on investing in actual stocks (buying and selling the underlying asset) instead of derivative financial instruments such as contract for differences (CFDs).
Beginners’ corner:
- What is Investing? Putting Money to Work
- 17 Common Investing Mistakes to Avoid
- 15 Top-Rated Investment Books of All Time
- How to Buy Stocks? Complete Beginner’s Guide
- 10 Best Stock Trading Books for Beginners
- 6 Basic Rules of Investing
- Dividend Investing for Beginners
- 5 Passive Income Investment Ideas
What is stock trading?
The opposite of spending money in the present is investing. It saves money for the future in the expectation that it will grow over time, but it also carries the risk of losing money, which is why it’s important to utilize all of the tools at your disposal when you invest.
One such investment vehicle is stock trading (investing in stocks or buying stocks). Stock trading definition is buying and selling shares in companies to make money from price fluctuations — traders monitor these price changes closely, intending to buy low and sell high, and in the process, make a profit.
The notion with investing is that money or capital is invested with the hope of growing your money over time; this is done by putting money to work in one or more types of investment vehicles.
Why is it important to start investing as early as possible?
Starting your investment journey early, particularly with stocks, offers the potential to grow your wealth and stay ahead of inflation. Over time, as you progress towards your financial goals, you can transition from stocks to the relative safety of bonds. This gradual shift helps balance your portfolio, maintaining growth while reducing risk as you near your target.
The easiest and most common approach for beginning investors to get exposure to stocks is through the stock market. Investing in stocks is simply purchasing small shares of ownership in a publicly-traded company.
By investing in these modest shares, you’re hoping that the firm will grow and prosper in the long run, which is the aim. As a result of the company’s growth, in the future, other investors may be willing to pay more for your shares, and if you decide to sell them, you’ll be able to make a healthy return.
Common investing mistakes
An inexperienced investor is prone to making costly errors due to overconfidence, impatience, or even naiveté. However, these blunders may be quite expensive; therefore, learning how to avoid them is highly recommended.
Before you begin investing, it is essential to obtain some knowledge in order to maximize your profits and minimize your losses. After reading this guide, you’ll have a better sense of the mindset you’ll need, the expectations you may have, and the techniques that will be most effective. Here’re the most common investing mistakes made by novice stock traders:
- Expect to get rich overnight: It is unrealistic for newcomers to expect to see significant increases in their portfolios overnight, although this sometimes happens in the stock market.
- Lack of time spent for Technical and Fundamental analysis: It is more likely that you will wind up as a gambler rather than a trader if you do not have the proper research mindset in place. In order to make an informed investment decision on any company, you must first understand how the firm makes money, what its competitive advantages and risks are, how fiscally sound the company is and how promising its future appears to be.
- Not having a proper trading plan: Plan your trade – trade your plan. Professional traders have their set up position with entry, exit, and stop losses set in mind before entering a trade and executing it. Unabated enthusiasm and even greed will drive far too many novice investors (and many seasoned investors, as well) to purchase shares of businesses, with little consideration given to whether the stocks are undervalued or overvalued.
- Following the wrong sources: For many new investors, it’s easy to place their trust in financial TV experts, YouTube tips or stock picks from a friend or colleague. Anyone may recommend a stock, but you seldom know the recommender’s track record – and even the best investors make mistakes from time to time; hence, in the long term, it’s highly advisable to learn the stock trading ‘magic’ yourself.
- Buying Penny Stocks: Traders may purchase penny stocks for as little as $5, with many of them trading for as little as $1. For new traders, the appeal is that you can get a lot of shares for not much money. However, it is common for these stocks to sink to zero, and just a handful soar. It’s also worth noting that unprofitable businesses may easily be manipulated by scammers hype up online “pump-and-dump” in schemes.
- Not diversifying: Not diversifying enough is another common investing mistake. Owning ten energy companies and ten electric vehicle (EV) companies is not diversification. A drop in the price of oil or gas could change the fortunes of half your portfolio, as could chip shortage that could put factory production on hold. By investing in a range of industries and a range of countries, you can mitigate the risk.
- FOMO and buying stocks at all-time highs: Purchasing shares at a downturn in the market may result in significant gains in the future. It is better to avoid succumbing to the fear of missing out (FOMO) and buying shares at all-time highs. At times, exercising restraint and patience is the most sensible course of action. However, this does not imply that if the value of a certain stock falls, you should buy more. Do some research before purchasing any further shares.
- Not paying attention to investments: Even if you want to be a buy-and-hold (HODL) investor, you shouldn’t ignore companies you’ve already bought. Keep up with them if you want to get the most returns on your investments. Most recommend doing so at least once a quarter. Look at their quarterly financial reports to see how the business is performing and what the management says about it.
Which brokerage account is best?
An online brokerage account is all that’s required to start investing in stocks, mutual funds, and a range of other assets. Hence, as soon as you have determined what sort of investor or trader you want to be, you are ready to choose a brokerage account that is best for your needs.
Best Crypto Exchange for Intermediate Traders and Investors
-
Invest in cryptocurrencies and 3,000+ other assets including stocks and precious metals.
-
0% commission on stocks - buy in bulk or just a fraction from as little as $10. Other fees apply. For more information, visit etoro.com/trading/fees.
-
Copy top-performing traders in real time, automatically.
-
eToro USA is registered with FINRA for securities trading.
Before opening an account with a brokerage company, examine all the elements that matter most to investors.
For example, you should look into:
- How credible and safe the broker is;
- What are the fees (trading commissions, account fees);
- How easy it is to execute a trade on the platform (UX interface);
- Does it offer alternative investment options like stocks, mutual funds, and a wide range of commission-free exchange-traded funds (ETFs), etc.;
- Minimum balances and deposits;
- How easy it is to find helpful information on the platform;
- Customer support reputation;
- Does the broker offer a free demo account;
- A wide range of trading tools and indicators to use.
However, after your brokerage account has been created, you can start investing in the stock market by depositing money into the online investment account, which you can later use to purchase stocks, ETFs, or other desired investment products.
Best stock trading platforms and stock trading app for beginners
Below you’ll find our pick for the best commission-free brokers that are highly credible and suited for beginners. These platforms are specifically oriented towards providing an easy and convenient way to invest and trade stocks. Furthermore, these brokers are easy to onboard even via your smartphones and are suitable beginner-friendly options.
1. eToro
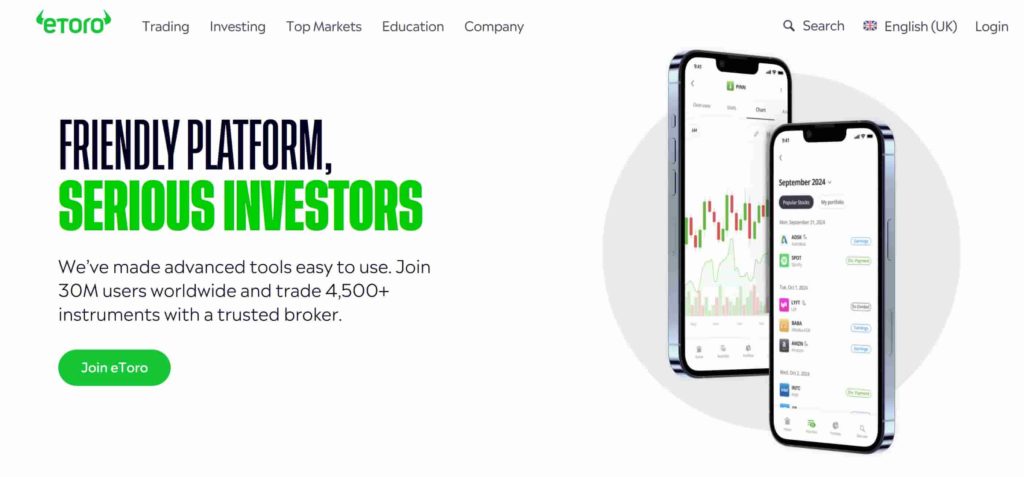
eToro stands out as a leading social trading platform, offering a unique combination of investment opportunities ranging from stocks and commodities to cryptocurrencies. Founded in 2007, eToro has pioneered the concept of social investing, enabling users to follow, copy, and interact with successful traders within the platform. This approach not only simplifies the trading process for beginners but also adds an element of community engagement that’s rare in the financial trading world.
Product Offering
eToro’s product offering is diverse, catering to various investor interests and strategies. Users can trade in a wide array of assets, including:
- Stocks: Access to global stock markets with the option to buy fractional shares;
- Cryptocurrencies: A robust selection of popular digital currencies;
- ETFs: A variety of exchange-traded funds to diversify investment portfolios;
- Commodities: Opportunities to trade in metals, energy, and more;
- Forex: A comprehensive forex trading platform for currency trading.
One of eToro’s hallmark features is its CopyTrading feature, allowing investors to automatically copy the trades of experienced users, effectively democratizing access to expert strategies.
Fees and Charges
eToro’s fee structure is transparent, with no fees for stock and ETF trading, making it an attractive option for traditional asset investors. However, it’s important for users to be aware of other potential charges, such as withdrawal fees and overnight fees for positions held open in CFDs.
Platform Usability
Designed with user experience in mind, eToro’s platform is intuitive and user-friendly, suitable for both beginners and experienced traders. The platform also offers educational resources and a demo account feature, helping new users to learn and practice trading strategies without risk.
Security and Regulation
eToro is regulated by top-tier authorities, including the Securities and Exchange Commission (SEC) in the US, Cyprus Securities and Exchange Commission (CySEC) in Europe, the Financial Conduct Authority (FCA) in the UK, and the Australian Securities and Investments Commission (ASIC), ensuring a high level of security for its users. The platform also employs advanced security measures to protect user data and funds.
Highly Rated Stock Trading & Investing Platform
-
Invest in stocks, ETFs, options and crypto
-
Copy top-performing crypto-traders in real time, automatically.
-
0% commission on buying stocks - buy in bulk or just a fraction from as little as $10. Other fees apply. For more information, visit etoro.com/trading/fees.
-
eToro USA is registered with FINRA for securities trading.
2. Interactive Brokers
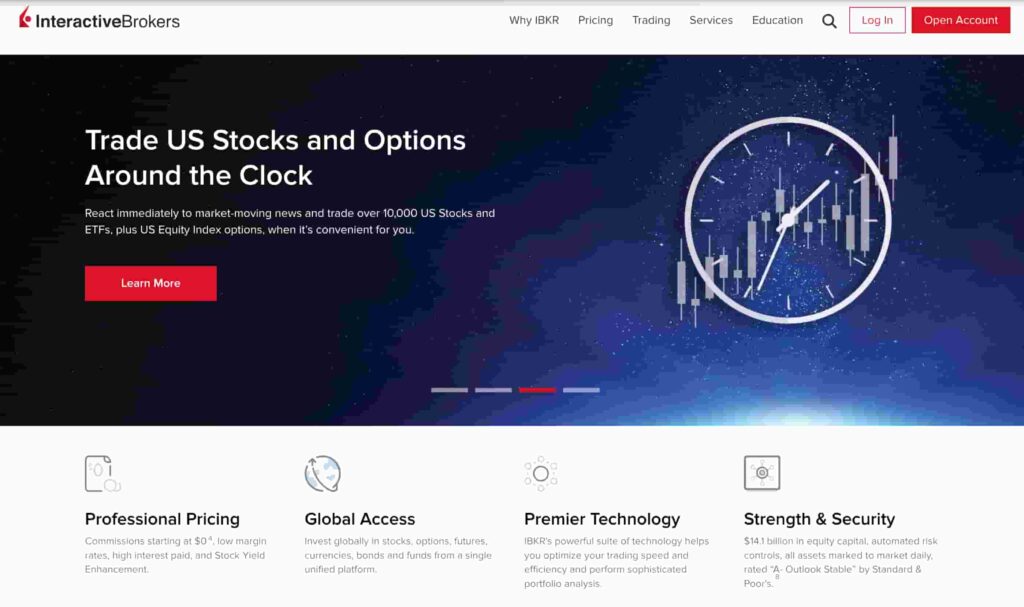
Interactive Brokers (also known as “IBKR” or “IB”) is one of the world’s largest and most recognized online brokers.
The broker focuses on extensive market access, competitive pricing, and efficient trade execution. Global exchange markets are available in the Americas, Europe, and the Asia Pacific for clients to invest in over 200 nations and territories.
- IBKR facilitates trading with stocks, options, futures, forex, bonds, and funds on over 150 different marketplaces from a single integrated account.
- Residents and institutions in the United States also have access to cryptocurrency trading with the broker.
- Interactive Brokers also offers a wide range of account types to its users, including individual, joint, retirement, trust, family, and institutional.
When it comes to fees, Interactive Brokers has a reputation for low fees and commissions and offers two types of accounts for individual investors: IBKR Lite and IBKR Pro.
- IBKR Lite has no account minimums and no inactivity fees for retail users trading publicly listed stocks and ETFs in the US whilst also offering zero commission on transactions. Thus, IBKR Lite is a more user-friendly platform for new investors.
- IBKR Pro is for experienced investors and traders. For stocks listed in the US, Interactive Brokers charges different forms of commissions subject to a set pricing structure.
Tier: The company has low broker commissions and inexpensive exchange, regulatory, and clearing fees. The IB commission per share for all US stocks, ETFs, ETPs, and warrants is $0.0035, with a minimum of $0.35 and a maximum of 1.0% of the transaction value for under 300,000 shares.
Fixed: Shares are priced at $0.005 per share, with a minimum transaction value of $1.00 and a maximum transaction value of 1%; all exchange and regulatory costs are included in the price. On all sales of US stocks, ETFs, and warrants, transaction fees are passed on to the stock buyer.
Best Platform for Worldwide Stock Trading & Investing
-
Highly trusted multi-asset broker with clients in over 200 countries
-
Trade on 150 markets globally from a single platform (stocks, ETFs, futures, currencies, crypto & more)
-
Low commissions starting at $0 with no platform fees or account minimums
-
Easily fund your account and trade assets in 26 currencies
-
IBKR pays up to 4.58% interest on cash balances of $10k or more

How to research stocks and choose the best?
Researching a stock is extremely useful, of course, since it helps you determine if a firm is worth adding to your portfolio or not by evaluating its financial performance.
Plan your trades by studying the fundamental and technical analysis of the stock.
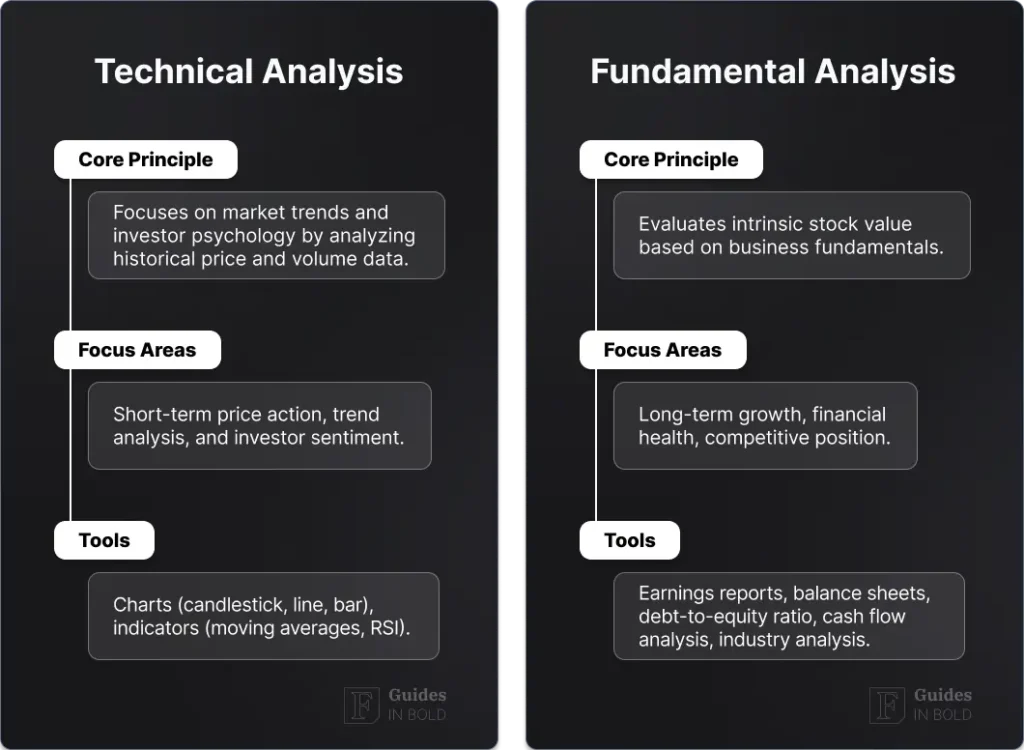
Technical analysis (TA)
The technical analysis evaluates assets and identifies trading opportunities by examining statistical trends from trading activity, such as price movement and volume patterns found on price charts.
Using historical trading behavior and price fluctuations, technical analysts predict future price movements for security. While technical analysis looks at past price patterns and stock movements, fundamental analysis focuses on the company’s financial health in the here and now.
When determining a stock’s worth, the technical analysis examines price and volume rather than business results like sales and profitability. Furthermore, technical analysis techniques are used to examine how variations in price, volume, and implied volatility are affected by supply and demand for an asset.
Lastly, the aforementioned analytical tool is commonly used to produce short-term trading signals using a variety of charting tools. Still, it may also aid in assessing a security’s strength or weakness concerning the larger market or one of its fields. This information helps analysts in refining their overall valuation estimates by providing more relevant data.
Technical analysts generally look at the following main categories of indicators:
Price Trends
A market or asset’s price trend indicates the overall direction of the market or asset’s price.
Trendlines or price action in technical analysis show:
- Uptrend: The price makes higher swing highs and lower swing lows for an uptrend.
- Downtrend: The price reaches lower swing lows and lower swing highs for a downtrend.
While most traders follow the trend, contrarians look for reversals or opportunities to trade against it. There are ups and downs, whether it’s the stock market, the bond market, or the futures market.
Below the downtrend is indicated by the purple horizontal line, and the blue horizontal line indicates the uptrend.

Using tools such as price action, trendlines, and technical indicators, you can determine when a trend is reversing and be alerted to it. Three trends indicate the overall direction of the price movement:
- Market price trends
- Asset price trends
- Metric price trends
Meanwhile, rising data points, such as higher swing highs and lower swing lows, characterize uptrends. However, downtrends have dropping data points, including lower swing lows and low retracement levels at the beginning and conclusion of the trend.
Price patterns are frequently used in technical analysis to identify transitions between rising and declining trends. A price pattern is, by nature, a recognized structure of price movement that is defined by a sequence of trendlines and curves.
A reversal pattern happens when a price pattern indicates a shift in trend direction. In contrast, a continuation pattern occurs when the trend continues in its present path after a short reprieve.
Many traders choose to trade in the same direction as the trend, hoping for a continuance of that trend to bring them profits. However, it’s important to note that trend lines can illustrate the general direction of a trend; the relative strength index (RSI) gauges how strong it is.
Chart Patterns
Technical analysis relies heavily on chart patterns, but mastering them is a process that takes time and practice. Patterns on a price chart assist you in predicting what prices will do in the future based on the past.
There isn’t a single “best” chart pattern that they’re all utilized to illustrate distinct trends in a wide range of industries. Candlestick trading frequently uses chart patterns, which makes it a little simpler to see past market openings and closes.
In volatile markets, certain patterns work better than others. Some patterns function well in a bullish market, while others are better suited to a bearish market.

The following are just some chart patterns, to name a few:
- Head and Shoulders: Investing professionals consider the head and shoulders chart one of the most accurate patterns for predicting trend reversals. An upward trend is nearing its conclusion when the head and shoulders chart depicts a change from bullish to bearish.
- Double Top: If the price has been moving up for some time, then a double top pattern will emerge. In technical analysis, “tops” refer to price levels that can’t be broken. After the price reaches this level, it will take a slight bounce off it before returning to re-test it.
- Double Bottom: This pattern will appear when two valleys or “bottoms” have developed after a long decline. This indicates that the selling pressure is going to end, and a reversal is likely to begin.
- Rounding Bottom: The Rounding Bottom is a long-term reversal pattern best suited for weekly charts representing a lengthy consolidation period that transitions from a bearish trend to a bullish trend.
- Cup and Handle: A price chart technical indication that looks like a cup with a handle is regarded as a bullish signal, with lower trade activity on the right side of the pattern.
Volume
In trading, volume refers to the total quantity of a particular asset exchanged during a given period. As a result, volume is frequently shown alongside price data as crucial market activity and liquidity measurement.

There must be a buyer and a seller for every contract exchanged for the transaction to take place – each transaction is a separate exchange and will contribute to the trading volume. It’s important to know that the trading volume does not include the number of actual transactions; instead, it counts the number of assets exchanged.
Moving Averages (MA)
In order to get a trend line, a moving average takes the price points of an instrument over a defined time and divides them by the total number of data points. Traders like it because it may assist in predicting the current trend’s direction while at the same time reducing the influence of random price fluctuations.
The simplest MA is the Simple Moving Average (SMA), which is just a computation of the average price of data collection over a certain period. For instance, you would divide the past ten days’ data by ten to calculate the SMA for ten days.

By examining the historical price movement of a stock, a moving average may help you determine where support and resistance are located.
Support and Resistance Levels
Support and resistance levels can provide traders with additional information about the strength of a price trend. Both support and resistance refer to price chart levels that appear to constrain market movement.
Resistance levels are those at which prices consistently stop climbing, while support levels are those at which prices consistently stop falling. In a buyer’s market, the price will rise if there are more buyers than sellers; conversely, the price will fall if there are more sellers than buyers.

The more frequently a price reaches either level, the more accurate that level is in predicting future price changes. Traders typically find that both levels become psychological barriers whenever they purchase or sell after reaching a certain level.
For instance, if a price reaches or surpasses a support or resistance level but immediately reverses course, it only tests the level. The price may rise or decrease until a new level of support or resistance is found if a price breaks through a certain level for an extended length of time.
- Read also: Widely used TA indicators and chart patterns explained:
- Stochastic Oscillator
- Bollinger Bands
- Average Directional Index (ADX)
- MACD Indicator
- Death Cross Pattern
- Golden Cross Pattern
- What are Chart Patterns? Types & Examples
Watch: Top 10 key chart patterns to be effective at trading by Trader DNA
Fundamental analysis
Plan your trades by studying the fundamental and technical analysis of the stock. Fundamental analysis is the term investors use to describe the evaluation of a company’s financials, leadership team, and competitors to determine if it merits a place in your investment portfolio.
Besides measuring the intrinsic worth of an investment to determine a stock’s value, fundamental analysis looks at:
- Earnings;
- Expenses;
- Assets;
- Liabilities;
- General public sentiments and press around the stock;
Conversely, the stock is also evaluated using technical analysis, which looks at the stock’s price and volume chart to anticipate future potential performance.
Quantitative research
In order to get started with your research, you should look at the company’s financials. You may start by collecting together a few documents that firms must submit with the Securities and Exchange Commission (SEC).
There are so many statistics in financial reports that it’s easy to get lost; thus, it is best to focus on these key metrics below in order to learn about a company’s quantifiable inner workings.
Form 10-K: An annual report that provides independently audited key financial statements. You may look at a company’s balance sheet, sources of income, cash management, and revenues and expenses here.
Form 10-Q: This is a quarterly update on operations and financial performance.
For those who are short on time, your brokerage firm’s website or major financial news websites will provide you with a summary of the reports mentioned above as well as all the essential ratios. Imperatively, this data will allow you to compare a company’s performance to other potential investment options.
In general, there are six things in these reports that are worth keeping an eye out for:
- Revenue;
- Net income;
- Earnings per sharePrice earning ratio (P/E);
- Return on equity (ROE);
- Return on assets (ROA).
All of the above will be discussed in more detail in the following heading, along with the reasons why they should be researched.
Net income
The net income is calculated after operating expenditures, taxes, and depreciation are deducted from a company’s revenue.
Revenue
Revenue is the amount of money a firm earns within a specific period (usually a year or a quarter of a year). Operational and Non-operational revenues are sometimes used to describe revenue.
It’s essential to look at operating revenue when choosing a stock because it is derived from the company’s primary activities. Non-operating revenue is frequently obtained from one-time commercial activity, such as the sale of an asset, rather than ongoing operations.
Earnings per share
Earnings per share or EPS are calculated by dividing earnings by the number of shares available for trading. If you want to compare a company’s profitability with other firms, you may use this figure.
With that being said, it is worth mentioning that a company’s earnings are far from a perfect financial evaluation since they don’t reveal its capital efficiency. Some firms reinvest their profits back into the business, whereas others distribute them as dividends to shareholders.
Price-earnings ratio (P/E):
- A company’s trailing P/E ratio is calculated by dividing its current stock price by its earnings per share over the past 12 months.
- Forward P/E is calculated by dividing the company price by Wall Street analysts’ anticipated earnings, which gives you the forward P/E.
If you want to know how much investors are willing to pay for a dollar of a company’s current earnings, you may use this stock valuation metric.
You should also take into account that the P/E ratio is determined from the possibly incorrect computation of earnings per share and that analysts’ predictions can occasionally be short-sighted. As a result, it’s not a trustworthy statistic on its own and should be used along with the other research tools.
Return on equity (ROE) and Return on assets (ROA)
How much profit a firm makes on each dollar invested by shareholders is revealed by the return on equity (ROE), which is expressed in percentage terms. The shareholders of the corporation own the equity.
Return on assets (ROA) measures how much profit a firm earns per dollar of assets. A company’s yearly net income is divided by one of the measures to calculate each of these metrics. Traders may gauge profitability from these percentages as to the company’s ability to generate revenue efficiently.
A corporation might artificially increase its return on equity by repurchasing its own stock to lower the shareholder equity denominator.
How much money to invest in stocks?
Golden rule
Set a budget
In truth, the amount of money required to purchase a single share of stock depends on how costly the shares are. It is possible to buy shares for only a few dollars or as much as several thousand dollars.
If you’re thinking about investing in stocks, you have a few options. You may invest in a variety of ways, depending on how thoroughly involved you want to be when it comes to picking and choosing the stocks you invest in.
Investing in individual stocks
Most experts recommend keeping these investments at a small percentage of your overall portfolio as a general guideline. Investing more than 10% of your portfolio in individual equities puts your investments at risk.
You might purchase one or two shares of a certain business to gain exposure to the stock market. Nevertheless, it is feasible to build a diversified portfolio out of a large number of individual equities, but it requires a substantial investment.
Additionally, mutual funds are unlikely to grow as quickly as individual equities as single-stock investments have the advantage that a well-chosen stock may pay off lucratively. Still, the likelihood that any one particular investment will make you rich is quite low.
Investing in funds – mutual funds or ETFs
Most financial counselors prefer investing in funds; especially if you have a lengthy time horizon, you may put substantial portions of your portfolio into stock funds.
There are advantages to investing in mutual funds or occasionally known as equity mutual funds:
- They are already diversified. An investment portfolio dominated by mutual funds is the obvious choice for most investors, especially those investing their retirement savings, as it diversifies the risk.
- You can purchase small portions of several different equities in a single transaction with a mutual fund.
Index funds and exchange-traded funds are mutual funds that track an index, for example, buying the shares of the firms that make up the index. Your investment in the fund gives you a piece in each of the firms that are part of it. Furthermore, it’s possible to combine numerous funds to create a diversified investment portfolio.
If you want to invest in mutual funds but have a limited budget, an exchange-traded fund may be the best option for you. But ETFs trade like stocks, which means you buy them for a share price — in some cases as low as $100, whereas mutual funds generally have minimums of $1,000 or more.
Know more about ETFs and Mutual Funds:
How does stock trading work?
An investor who trades through a brokerage must submit an order for the deal to be completed. The broker is an intermediary who receives a buy or sell order from a customer, and the buy or sell orders are then executed when they are filled.
With a brokerage account and a set budget in place, stock traders can utilize the brokerage’s website or trading interface to buy the stock. You’ll be able to choose from a variety of order types, which will determine how your transaction is executed.
Stock trading is now easier than ever before, and although the process may seem intimidating initially, we will give you guidance for each step of the way below.
Stock trading strategies: choosing the right one for you
It is better to get a solid understanding of both stocks overall as well as different stock trading strategies before buying a stock and executing trades. Stock trading is a type of investment that focuses more on short-term rewards and prioritizes less on long-term benefits.
In popular culture, traders are portrayed as frenetic characters on Wall Street, like Jordan Belfort on The Wolf of Wall Street who buy and sell throughout the day while staring at monitors and scrolling tickers. Conversely, investors tend to hold on to their investments until retirement, buying and selling infrequently instead of purchasing and selling at intervals.
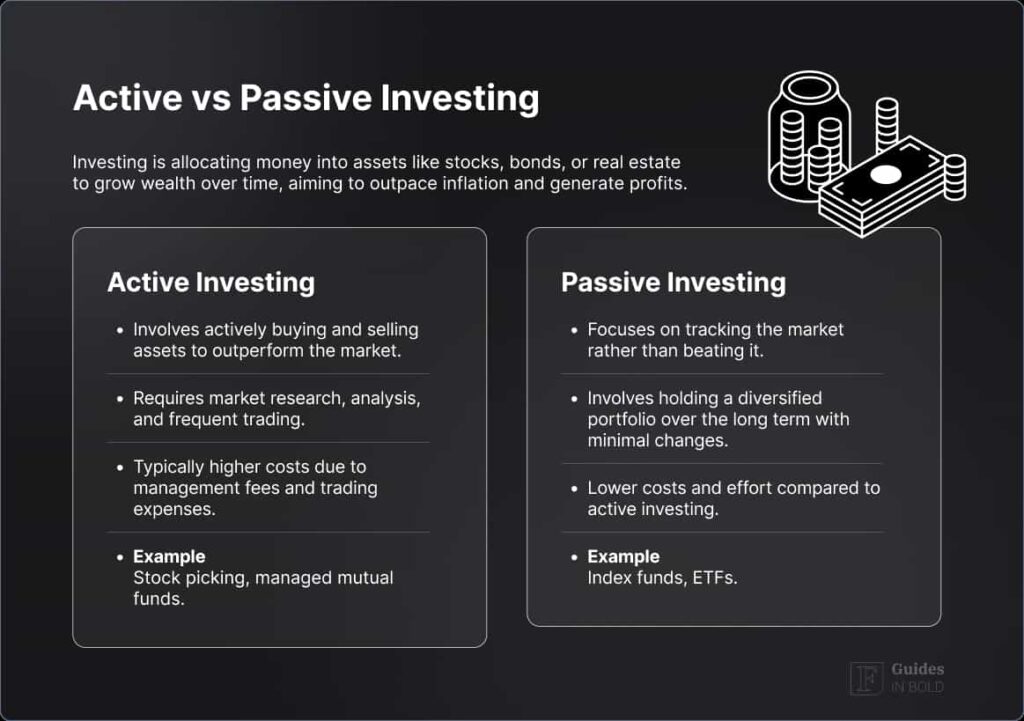
Investment strategies that focus on short-term trading have a different approach than those that focus on long-term, buy-and-hold investing.
Short-term fluctuations and seizing the market trend, according to active traders, are where the gains are generated. However, passive investment offers lower costs, simpler management, and better after-tax returns for investors with a medium to long time horizons.
Listed below are a few popular trading strategies:
Day Trading
A practical day trading strategy makes use of asset price volatility to the trader’s benefit. Traders benefit from highly volatile assets since it allows them to make more money in the short term.
The day trading approach is based on playing the numbers game rather than analyzing the trends. A day trader will make several trades throughout the day, buying cheap and selling high in small profits that add up to huge sums at the end of the day.
Scalping
Scalping is a trading method in which traders benefit from tiny price fluctuations. Here, the traders benefit from tiny price swings and reselling quickly for a profit. Essentially, scalping is a day trading strategy that refers to a technique that emphasizes generating large volumes of tiny profits. Consider the time in minutes.
To be successful in scalping, a trader must have a well-defined exit plan because even a modest loss might wipe out all of the small gains the trader has made. As a result, having the proper tools such as a live feed, direct access to a broker, and the endurance to execute several trades is necessary for this approach to be effective.
There will be numerous successes and losses during day trading or scalping, and the goal is to have a positive win/loss ratio.
Swing Trading – days/weeks/months
The time duration differs when it comes to swing trading. Traders that engage in day trading frequently open and terminate positions during the course of the day. On the other hand, swing trading occurs over a considerably longer length of time, and the trade might be anything from a few days to a few months.
A swing trader’s goal is to profit from a changing or continuing trend in the market. In other words, it implies buying when things are low and selling when they are high. To be successful with this method, you’ll need to effectively apply both Fundamental and Technical analysis strategies.
Long Term investing – months/years
Long-term trading is a trading strategy in which a trader holds onto a position for a longer duration. It is possible to hold a position for a short period or for several years. It’s a solid technique for investors who like to take a more hands-off approach.
When it comes to long-term trading, most traders depend significantly on fundamental analysis because their primary focus is on the market’s prognosis for the future. They don’t pay attention to the day-to-day fluctuations as much as to the underlying fundamentals that drive the overall trend. Long-term traders utilize daily, weekly, and even monthly charts to analyze the market since they have a longer time horizon.
Bids and Asks
A bid price is the highest amount you’re willing to pay to purchase a share of a company’s stock. The asking price, on the other hand, is exactly the reverse. The minimal price at which the seller is willing to sell the shares is represented by this number. Decide on the right bid and ask price to achieve a profitable trade.
Learn to use market and limit orders
There are different types of orders used in trading – choosing a stock order type is part of executing a trade when you buy or sell a stock, and most orders fall under the following two categories: stop-limit orders and stop-loss orders.
Market Order
- Because a market order does not specify a price, your order will be executed quickly and filled.
- The price you pay (or get, if you’re selling) may differ from the amount you were given only seconds before.
- As the day progresses, the bid and ask prices vary continuously. Hence, when buying large, stable blue-chip stocks rather than smaller, volatile firms, a market order is the ideal method to utilize.
- Buy-and-hold investors prefer a market order because tiny price variations don’t matter as much as ensuring that the deal is executed.
It’s worth remembering that If you place a market order trade “after hours,” when the markets have closed for the day, your order will be filled at the current market price when the exchanges reopen for trading.
Limit Order
If you use a limit order, you have more control over the price at which your transaction is executed. For example, if a stock is now selling at $50 per share, but you believe that a price of $40 per share is better in accordance with your opinion of the firm, a limit order instructs the broker to wait and execute your order only when the asking price falls to or below that level.
On the other hand, selling a limit order directs your broker to sell the shares as soon as the bid hits a specific amount.
On a limit order, you may add extra conditions to govern how long the order remains open such as:
- An “all or none” (AON) order will only execute if all of your desired stock is in the market at the price you specify;
- Good for day orders (GFD) expire at the conclusion of the trading day, even if they have not been fully completed;
- Good-till-canceled orders (GTC) stay in effect until the client cancels them or the order expires, which can take anywhere from 60 to 120 days.
Use a Stop-loss order
The stock market is characterized by a high degree of volatility. For this reason, a beginner needs to learn how to avoid a heavy loss. You must establish a stop-loss order price while completing a transaction in order to minimize your losses. Since a failure to put a stop loss in place might result in a significant loss of capital.
Automated investment
Automated investment management is available through Robo-advisory services, an automated investment adviser.
Most large brokerage companies and many independent financial advisors provide these services, which may be worthwhile for those who would like an expert to manage the trading process for them.
These firms will question your investment goals during the onboarding process and then construct a portfolio to meet those goals by investing your money according to your financial objectives.
Practice with a demo trading account
Simulators and demo trading accounts of the stock market aim to mimic real-life conditions and performance as closely as possible. A demo trading account is a great method to grasp investing terminology while practicing trading and investing with virtual funds.
Some brokerages have a Practice Mode or Demo Account, which gives you free access to a wide selection of instruments and unrestricted trading as if you were using real money and you can apply the skills you learn on a practice account to an actual trading account.
With that being said, many variables influence trading and investing decisions in the real world, such as risk tolerance, investment horizon, investment objectives, taxes concerns, and the need for diversification. You cannot take investor psychology into account because actual physical cash isn’t on the line in this case.
Learning how to trade and develop a portfolio in a secure environment where you can make mistakes such as mistyping ticker symbols or misunderstanding order types is the best place to practice without causing any financial damage.
Here are a few brokerage accounts where you may practice trading with a demo account.
1. WeBull Paper Trading: Virtual Trading Simulator Account
WeBull paper trading offers a lot for those who are new to trading. The platform provides a demo account that allows you to test out different methods while also giving the instruction you need to develop some experience. Using a paper trading account at Webull is a straightforward procedure.
2. eToro Demo Trading Account
eToro is a social trading platform, which distinguishes it from the majority of other platforms. As a result, understanding the eToro trading platform using a practice account is quite beneficial. The eToro account is free, comes with $100,000 in eToro virtual money, and has no time restrictions.
3. Account TD-Ameritrade Broker Demo
ThinkOrSwim is TD-Ameritrade’s proprietary trading platform, and it is offered to US traders as a desktop, online trader, or mobile trading platform. TD-Ameritrade provides a sample account with full access to the ThinkOrSwim platform to allow you to experiment with it without risk. A virtual trading balance of $100,000 is offered to practice trading with free access for 60 days.
Derivative instruments
Another way of capitalizing on stock price movements is through the use of derivative instruments, which differ from traditional stock trading. Derivatives are financial contracts whose value is derived from the performance of an underlying asset, such as stocks. Unlike buying stocks outright, derivatives allow traders to speculate on the rise or fall of stock prices without owning the actual shares.
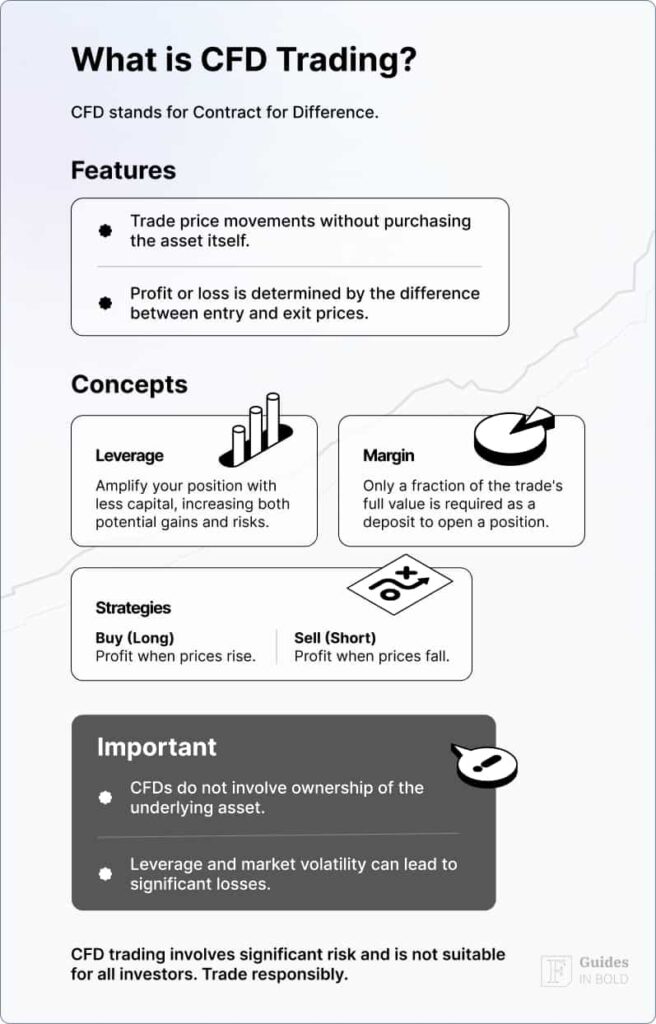
Contract for Difference (CFD)
A CFD is a financial contract that compensates for the differences in the settlement price between open and closed trades. CFDs enable investors to trade the direction of assets in a very short time. They are particularly popular in the forex and commodities markets.
Due to their status as an over-the-counter (OTC) product, CFDs are prohibited in the U.S. as they don’t transit via regulated exchanges. Additionally, the use of leverage increases the likelihood of greater losses, which is a subject of concern for regulators.
Options
Options contracts offer traders another strategic avenue for participating in the stock market. Unlike CFDs, which involve the speculation on the rise or fall of stock prices without owning the actual stocks, options contracts give the holder the right, but not the obligation, to buy (call option) or sell (put option) a stock at a predetermined price before a specified date. This allows traders to hedge against potential losses, speculate on stock movements with limited risk, or even generate income through selling options.
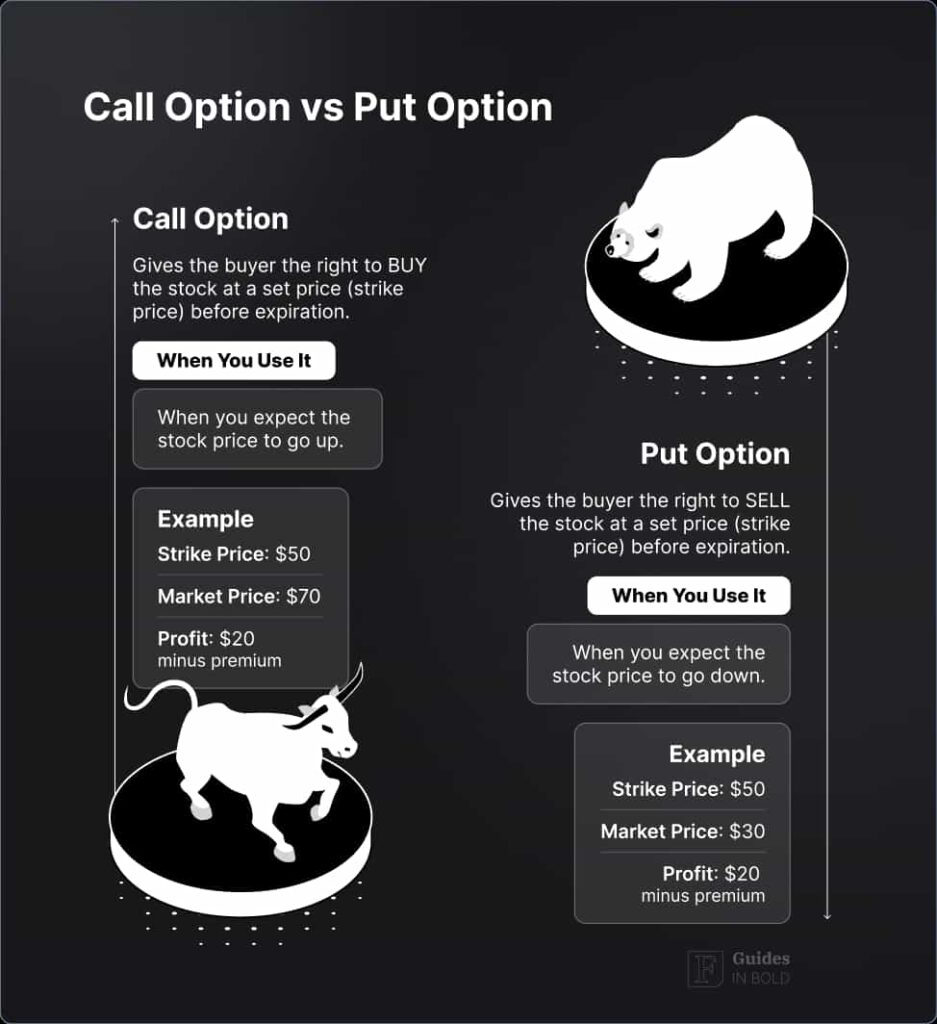
Options can be complex financial instruments requiring a good understanding of market conditions, the specific stock, and how different options strategies can be employed to achieve one’s trading objectives.
Building an investment portfolio: Tips
Building an investment portfolio that is diversified as well as consisting of well-researched stocks may be only the beginning of your journey, but investors who are willing to put in time and effort may reap the rewards.
Develop a plan and take a long-term view. Building an investment portfolio isn’t an easy task, and there will be fluctuations in your investments, and you must establish an investment plan that allows you to maintain your convictions during times of market volatility and bear markets.
Even if a stock you have bought decreases without cause, this long-term perspective calls for the mental fortitude necessary to buy and hang on to equities you believe in.
There will be years with positive returns and years with negative returns, and individual stocks themselves will also have varying returns. If you’re planning to invest over a long period, the stock market is a smart choice, regardless of what happens on a day-to-day or annual basis.
- Dollar-cost averaging: By buying over time reduces investors’ risk of price volatility. In dollar-cost averaging, money is invested at regular periods, such as weekly or monthly. For instance, you may buy more shares when the stock price is low and fewer shares when the stock price is high, eventually evening out your cost per share over time, resulting in a more equitable distribution of the price you pay.
- Automatic investment schedule: Some online brokerage firms offer an automatic investment schedule for dollar-cost averaging that may be set up for investors to take advantage of.
- Investing for the long-term: Long-term investing in the stock market has shown to be one of the finest methods to build wealth. S&P 500 stocks averaged 10-year returns of 12.15%.
- Passive investing: You should avoid looking at your stocks or mutual funds after you start investing in them. Aim of passive investing strategies is to avoid obsessively monitoring how your stocks are performing multiple times a day unless you’re attempting to defy the odds and win at day trading.
- Stick to the basics: The stock market is rife with complex techniques and tactics, yet some of the most successful investors have stayed true to the stock market basics. For the most part, this implies relying on funds for the majority of your investment portfolio and buying individual stocks only if you believe in a company’s long-term potential growth;
- Cash and cash-equivalent assets: In higher-rate environments, holding some cash or money-market funds can provide flexibility, income, and downside protection during periods of market volatility.
How to manage your stock portfolio?
Although it’s probably not healthy to check your portfolio every five minutes now and again, it is essential to re-evaluate your portfolio a few times every year to ensure it’s still in line with your investing objectives.
Just a few things to keep in mind:
- A few of your stock holdings may benefit from a shift to more cautious fixed-income assets if you’re nearing retirement.
- To increase your portfolio’s diversification, purchase companies or funds in a different industry. If your portfolio is too highly weighted in one area, and that particular industry is hit, all your stocks in that one sector of your portfolio will suffer as a result.
- Similarly, pay attention to geographic diversification as well, if possible, as geopolitical or natural events can end up affecting your investments.
- Vanguard advises that international stocks should make up to 40% of your portfolio, or you can invest in international mutual funds to gain exposure to the global equity markets.
Best platforms to plan your first trades
Even while buying individual stocks appeals to many investors, for those with less experience, the risk may outweigh the reward. It’s essential for investors to have a way to keep track of market developments and make informed decisions about their next move. Thus, a solid platform will help you plan your trade.
Helpful investing platforms can assist the ordinary investor by making recommendations on buying particular stocks while limiting risk. The stock suggestions from these sites have been well studied and could help you reach your investment goals by making locating investment opportunities even simpler.
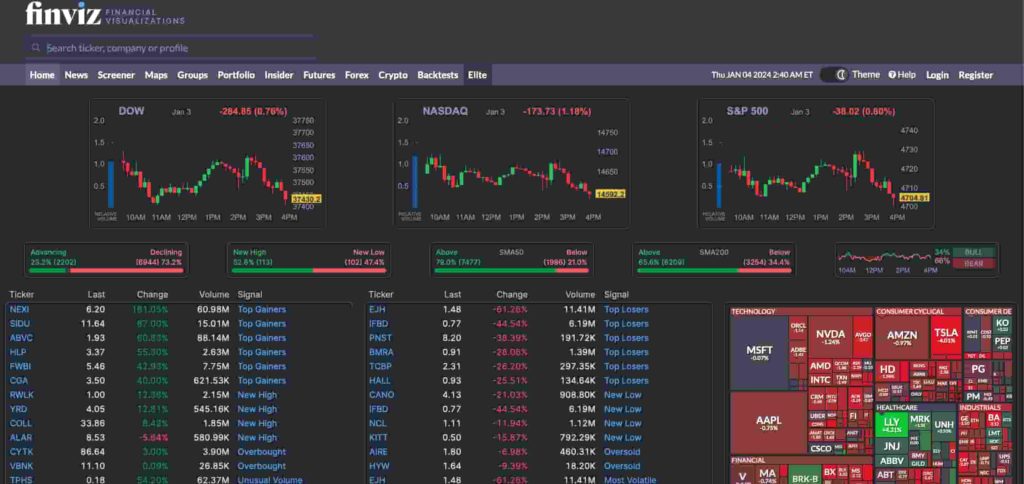
- Finviz – is a cutting-edge, all-in-one market screener that includes everything from pricing and technical analysis to earnings and much more. This platform allows traders and investors to quickly establish a macro market view by screening and finding stocks based on set criteria.
- Tradingview – It is a reliable community-driven platform for reviewing stocks in real-time on a more technical level; if you want to start trading, you can follow hundreds of professional traders who publish and share their setups openly, so it is worthwhile to learn from them and assess how similarly you think.

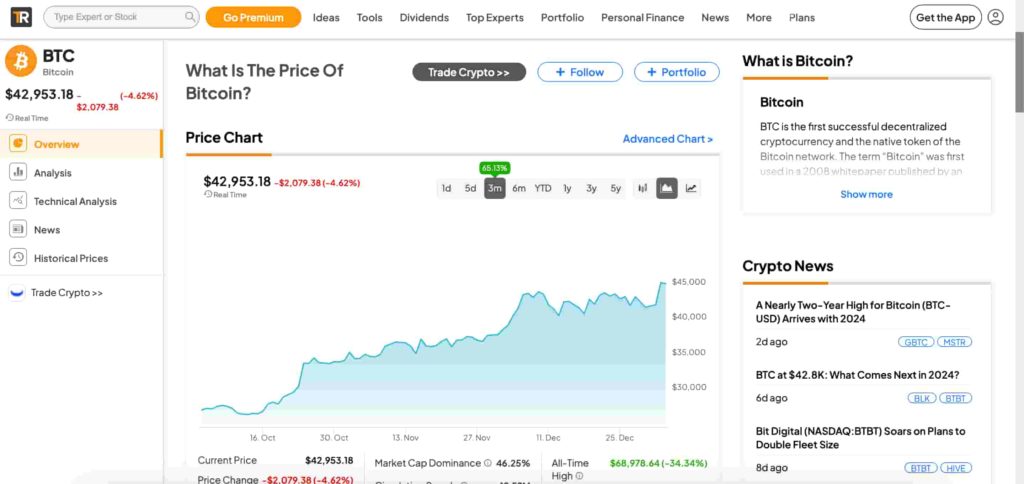
- TipRanks – The platform assesses financial analysts’ and financial bloggers’ public stock recommendations and ranks the experts based on accuracy and performance. Since the platform reflects Wall Street analysts’ sentiments and predictions for the stock, it can assist you in selecting your next move.
Conclusion
Successfully investing in the stock market may provide numerous possibilities to build wealth, with the potential for substantial returns on investment. Conversely, volatility is a critical component of the stock market. As an investor or a trader, you will experience ups and downs. Hence, beginners must grasp how the stock market works in order to succeed.
In the beginning, a significant financial loss may cause you to lose confidence. Prices of stocks fluctuate due to a variety of factors such as the news, fundamentals, and technical analysis.
Following and studying the recommendations and ideas in this guide will help you better understand stocks and the market in general, allowing you to decide whether to enter or exit a trade based on the information presented.
The stock market is fraught with uncertainties, and nobody can accurately predict a stock’s price. If you’re a novice, staying up-to-date with the latest news and stock forecasts will help determine the best trading decisions to make from the tools at your disposal.
Disclaimer: The content on this site should not be considered investment advice. Investing is speculative. When investing, your capital is at risk
Stock trading FAQs
Can I buy a stock for $1?
It doesn’t matter how expensive the stock is per share; you may still own a portion of a share for $1. Fractional share orders are not available for all investments. However, with some brokerages, a company’s stock must be valued at more than $1 per share and have a market capitalization of more than $25 million for you to be able to buy fractional shares.
What is stock trading?
Stock trading (or buying or investing in stocks) is an investing technique where investors buy and sell company shares to profit from price fluctuations. Stock traders monitor prices closely to buy high and sell low and to earn money from the price differences in the process.
What's the difference between stock trading vs investing?
When it comes to buying and selling stocks, the major distinction is how often you do it. Trading is more frequent, whereas investing tends to be more long-term, with investors buying and holding for the foreseeable future.
What are stock trading hours?
Trading on the New York Stock Exchange (NYSE) or the Nasdaq Stock Market (NASDAQ) takes place Monday to Friday from 9:30 am to 4:00 pm Eastern Time (ET). The starting price of a stock is determined by trading in the morning, while the closing price is determined by trading in the afternoon at 4:00 pm. Trading can also take place in what is called pre-market and after-hours.
What are the London stock exchange trading hours?
The London Stock Exchange (LSE) trading hours are from 8:00 AM to 4:30 PM GMT, Monday through Friday, excluding public holidays.
Is Buying Under 100 Shares of a Stock Worth It?
No matter how many shares of a stock you purchase or sell, brokerage firms generally charge the same commission, and those fees represent a greater proportion of the stock price for smaller transactions. A small purchase of fewer than 100 shares can still be beneficial, especially with today’s cheap costs. But it’s only worthwhile if you think you’ll be able to recoup the expenses at sell-time.
What is the best stock trading platform for beginner?
Both Interactive Brokers and eToro are good options for beginners, each offering unique features that cater to different aspects of starting in stock trading.
How to read stock charts for day trading?
To read stock charts for day trading effectively, focus on understanding price movements, volume, and key technical indicators like moving averages and RSI. These elements help identify trends, patterns, and potential trading opportunities. Practice and experience are essential for interpreting these charts swiftly and making informed decisions.
What is the best indicator for stock trading?
The best indicator for stock trading often depends on the trader’s strategy and market conditions. However, moving averages are widely regarded for their ability to highlight trends by smoothing out price fluctuations over a specified period, making them a versatile tool for many traders.
Is stock trading gambling?
Stock trading is not gambling when approached with research, analysis, and a clear strategy. Unlike gambling, which relies on chance, stock trading involves making informed decisions based on market data, company performance, and economic indicators. However, without due diligence, it can carry risks similar to gambling.
Is stock trading haram?
Stock trading is generally considered permissible in Islam if it meets certain ethical criteria, making it halal. The key considerations include avoiding companies that deal in prohibited (haram) industries like alcohol, gambling, and interest-based finance. Additionally, speculative trading practices resembling gambling are discouraged. Muslims seeking to engage in stock trading should adhere to Islamic finance principles, possibly consulting with a knowledgeable person in Islamic law to ensure their investments align with these guidelines.
What is GTC in stock trading?
In stock trading, GTC stands for “Good Till Canceled.” It’s an order type that remains active until the trader decides to cancel it or the order gets filled. Unlike day orders that expire if not executed on the same trading day, GTC orders can carry over multiple trading sessions, providing flexibility for traders aiming to buy or sell at specific price levels without needing to re-enter their orders daily.
What is the best stock trading app in Canada?
One of the best stock trading apps in Canada is offered by Interactive Brokers. Known for its comprehensive trading tools, extensive market access, and competitive pricing, Interactive Brokers caters to both novice and experienced traders looking for a robust platform to manage their investment portfolio efficiently.
When is the best time to buy stocks?
The best time to buy stocks is typically when the market is undervalued or when you have a long-term perspective, allowing you to take advantage of market upswings and compounding returns over time.
Is it still worth investing in stocks during periods of high interest rates?
Yes, although higher interest rates can pressure valuations in the short term, long-term investors often continue to invest gradually, focusing on diversification and consistent contributions rather than market timing.