Latest technical indicators suggest that XRP investors may have to wait longer for a price breakout, as the token is flashing bearish signals.
In this context, cryptocurrency analyst Alan Santana highlighted the bearish probability in a TradingView post on September 1, noting that this signal emerged after XRP broke below the critical 55-day exponential moving average (EMA55) support level.
Notably, this level has historically indicated significant downward movement. According to Santana, XRP has been testing the EMA55, and the drop could signal the start of another major decline. This pattern is not new; similar breaks below the EMA55 in April and August led to substantial drops in the token’s value.
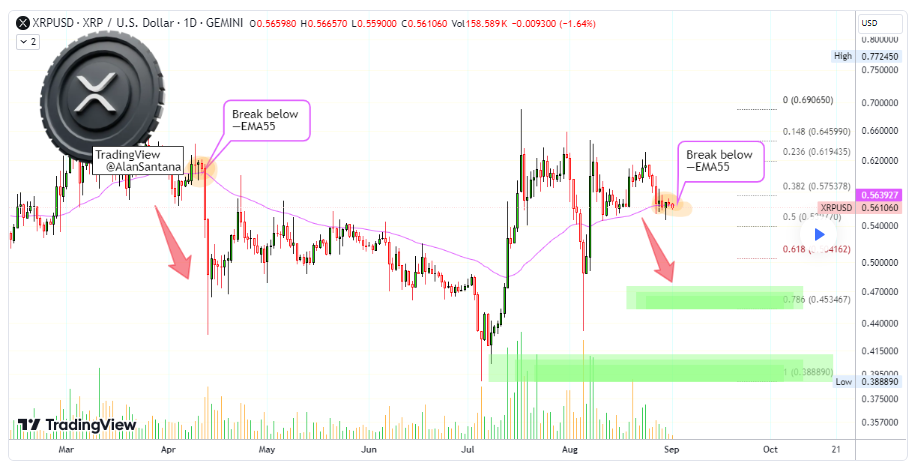
The analyst indicated that XRP could be on course to test lower support zones. Specifically, the next potential targets are in the $0.453 to $0.455 range, marked by the 0.786 Fibonacci retracement level.
If the bearish momentum intensifies, the cryptocurrency could drop to as low as $0.388, a critical support level highlighted by the 0.886 Fibonacci retracement.
While Santana emphasized that the bearish signal needs further confirmation, he noted that current market conditions and historical precedents suggest a high probability of continued downward movement. The formation of long-term and short-term lower highs, coupled with strong bearish action, supports this outlook.
Indeed, this bearish prediction comes when XRP faces increased pressure after Ripple unlocked one billion tokens on September 1. While token unlocks often lead to short-term price declines due to increased supply, the long-term impact depends on various factors, including market sentiment, project fundamentals, and overall market conditions.
XRP’s bullish outlook
Looking at the long-term price projection, a crypto analyst with the pseudonym Brett Crypto pointed out that XRP seems stuck in a time loop. The expert noted that despite the long-awaited resolution of its legal entanglement with the Securities and Exchange Commission (SEC), XRP’s price remains in a tight range, oscillating between $0.49 and $0.61.
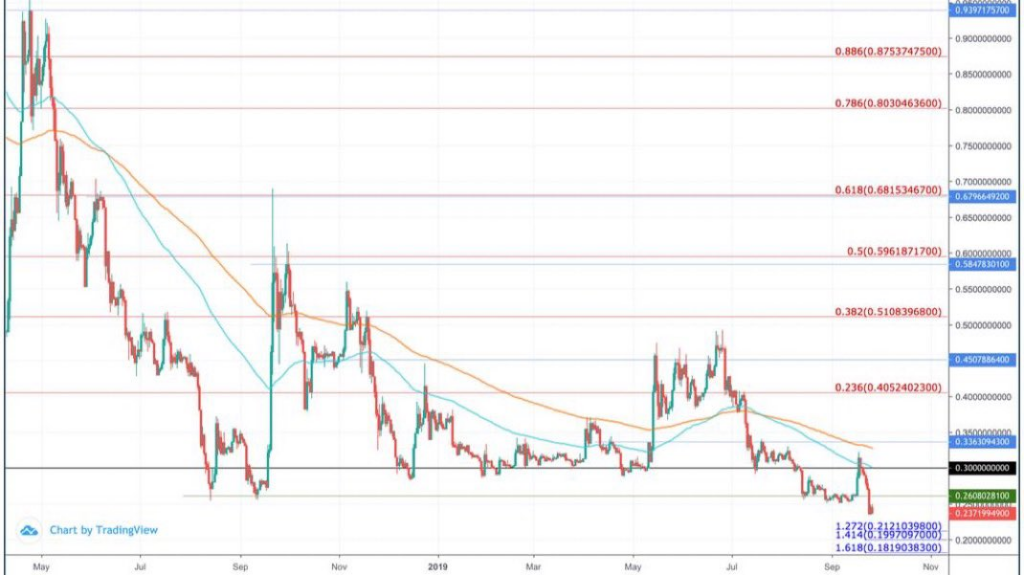
According to technical analysis, XRP is bouncing around key Fibonacci retracement levels, a telltale sign that the cryptocurrency is moving in a predictable pattern. Historical price data also suggests that XRP has been in this position before, and each time, the price either catapults higher or sinks lower, depending on market sentiment.
Brett Crypto noted that if XRP breaks out of the current price level, it might lead to “financial fireworks,” with the next high target at $0.90.
XRP price analysis
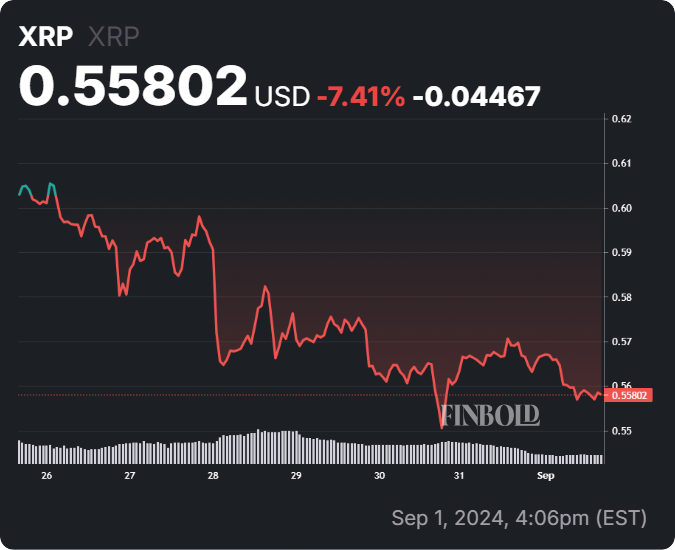
As of press time, XRP was trading at $0.55 with daily losses of about 1.5%. On the weekly chart, the token is down over 7%.
Overall, amid the current movement, XRP is showing moderate volatility at 5.03%, indicating that the token has not experienced extreme swings and reflecting a relatively stable trading environment.
At the same time, the 50-day simple moving average (SMA) for XRP is $0.577181, which is slightly above its current price. Trading below this short-term average suggests a bearish trend, with potential resistance around this level if XRP continues to trade below it.
On the other hand, the 200-day SMA is $0.546855, indicating a bullish long-term trend. Being close to the 200-day SMA suggests that XRP is near a key support level; holding above this level could be crucial for any potential upside.
Disclaimer: The content on this site should not be considered investment advice. Investing is speculative. When investing, your capital is at risk.