
After several months of stability near $67,000, Bitcoin (BTC) found itself in turmoil in the crypto markets in recent months. First, in June, it fell below $56,000 on fears that a major German government sale of seized cryptocurrency and Mt. Gox repayments would cause a crash.
Then, after some recovery through July, Bitcoin again crashed – this time below $50,000 – in early August as part of a wide bloodbath that also temporarily collapsed the stock markets on fears of instability in Asia and a looming recession in the U.S.
Finally, by the early morning of August 7, technical analysis (TA) revealed that the world’s premier coin is set to form one of the big bearish signals on its daily chart – the death cross – and Finbold examined what that could mean for BTC and if there is a chance of avoiding it.
Bitcoin set to form a death cross
The death cross chart pattern is indicative of recent price weakness and forms when a short-term moving average (MA) moves below a long-term moving average and tends to indicate the prices will continue dropping.
Should Bitcoin continue trading near its press time price of $57,114 in the short-term, it will have formed the death cross on its daily chart.
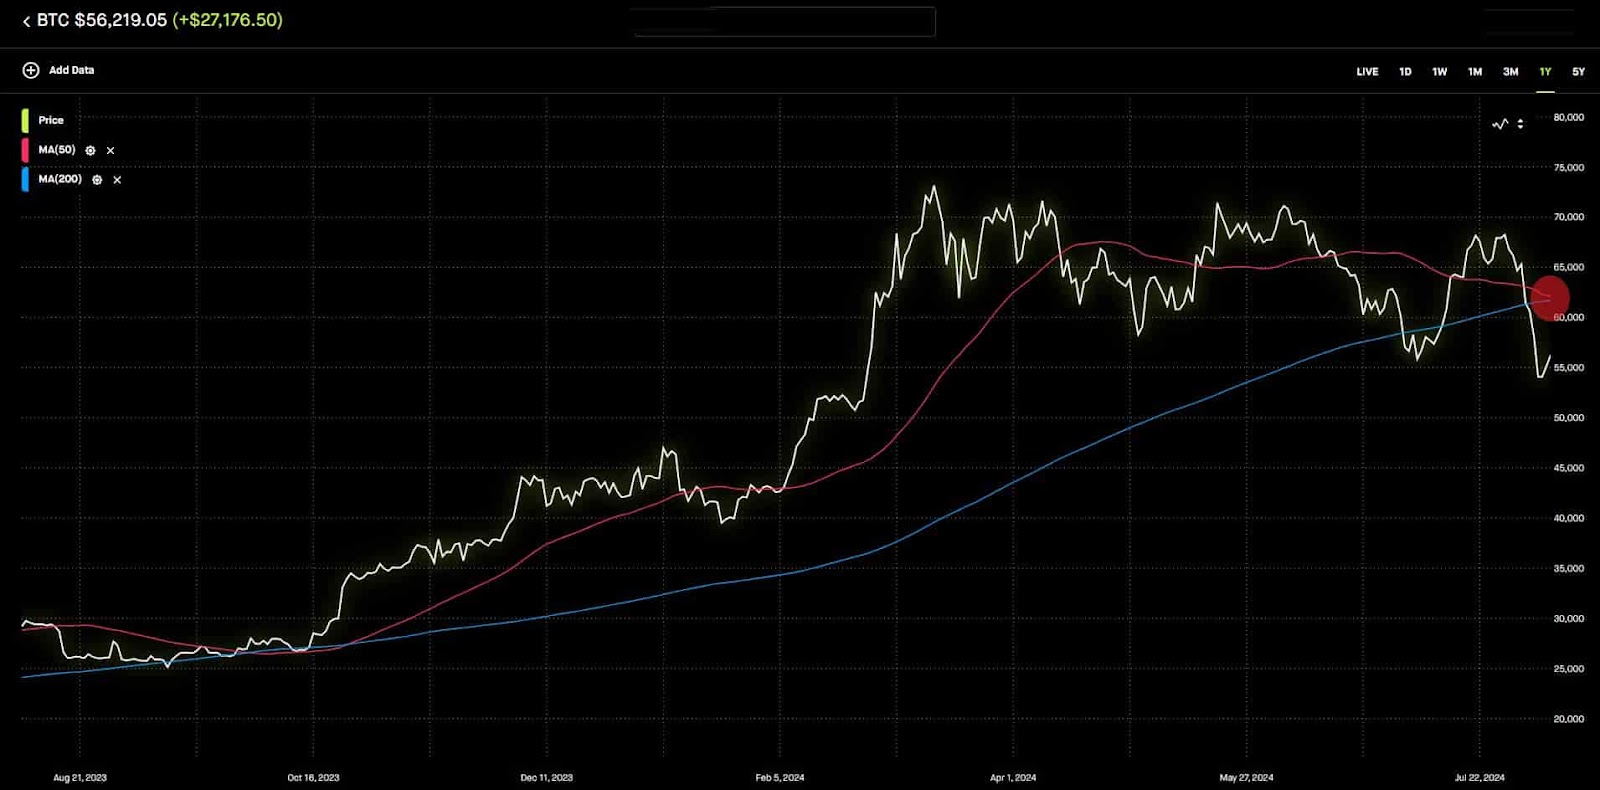
On the other hand, if BTC manages a climb to approximately $61,600, the chart pattern will be invalidated, and a strong possibility for a greater rally for the world’s foremost cryptocurrency will be created.
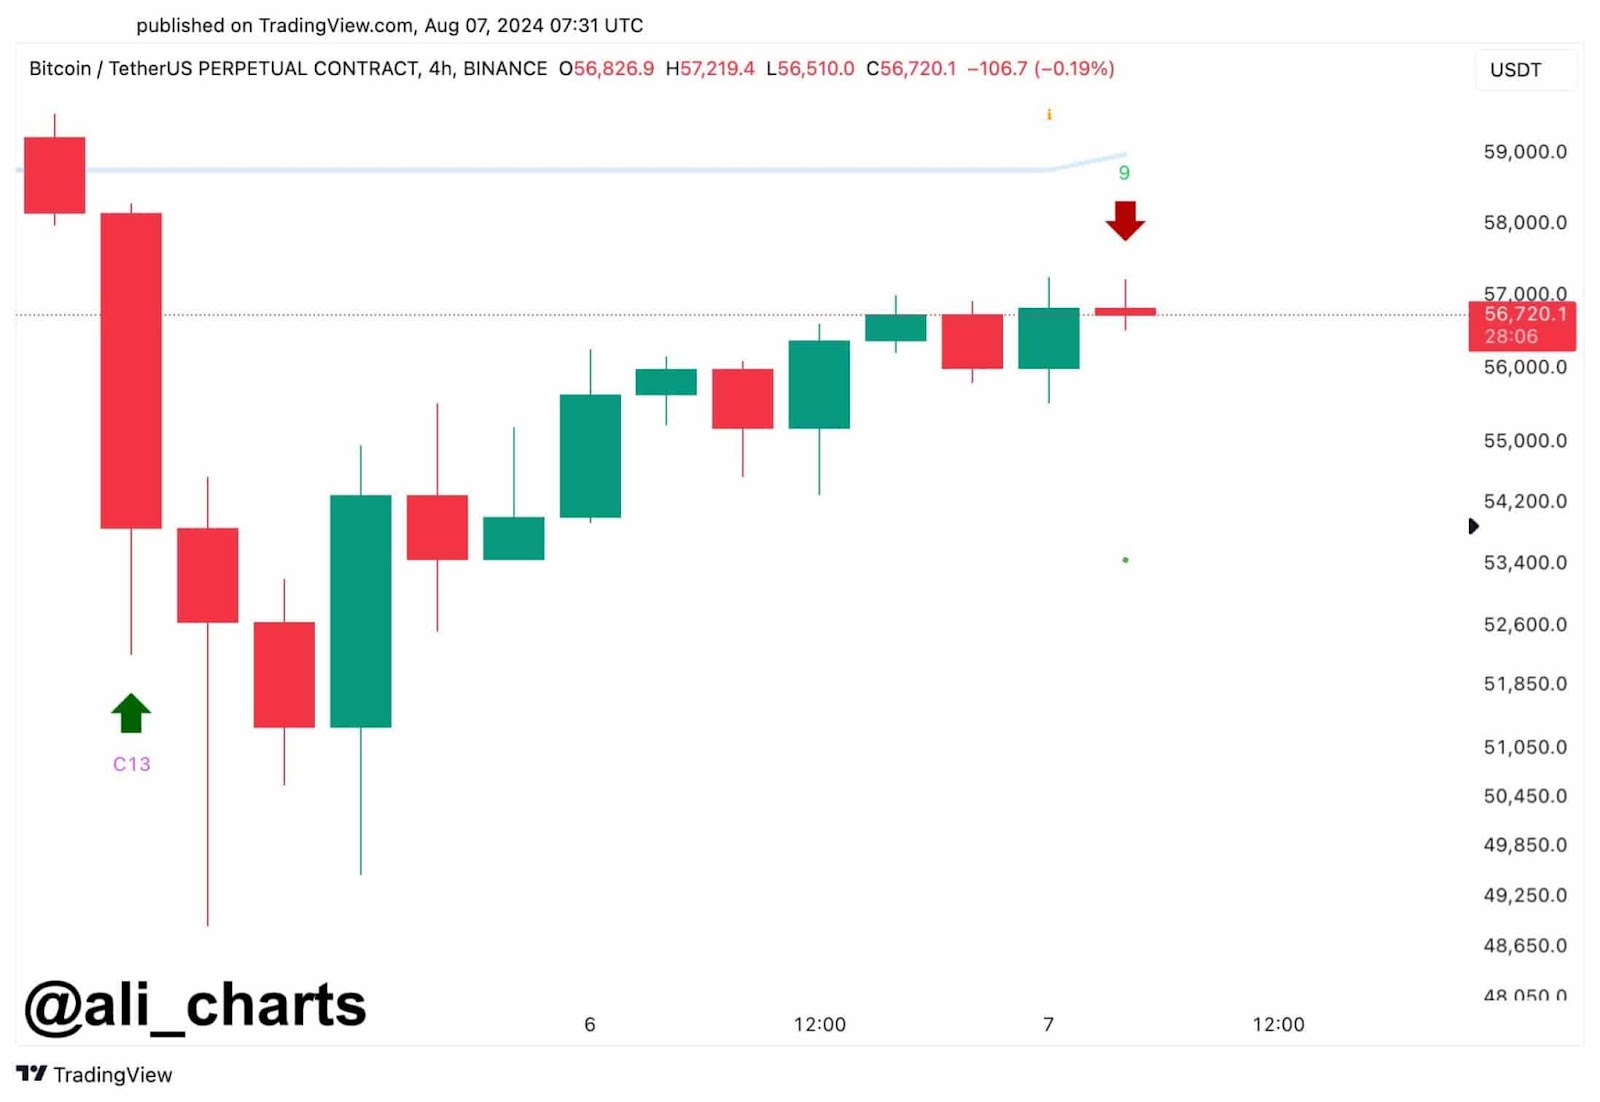
Still, a death cross chart pattern appears more likely than not as another technical analysis tool – TD Sequential – recently flashed a sell signal indicating Bitcoin’s next move will be downward.
Additionally, pseudonymous cryptocurrency expert Rekt Capital, explained on X that BTC will need to reclaim approximately $59,110 by the end of the week to regain some stability. The two factors combined mean that a rally above $61,000 is not particularly likely despite the coin being up 4.84% in the last 24 hours.
Still, despite a death cross being generally a strong sell signal, the downturn was neither particularly deep nor protracted the last time Bitcoin formed the chart pattern. Indeed, after the moving averages crossed in late April, BTC fell from about $64,500 to just above $58,000, only to make a full price recovery less than a month later.
Bitcoin price chart
Whatever the next move for Bitcoin may be, the fact remains that the coin has not performed strongly in the last 7 days of trading as it is 13.74% in the red in the time frame.
Still, as soon as the charts are zoomed out, BTC’s overall strong 2024 performance becomes apparent as, for example, despite the major decline since the start of August, BTC is only down 0.93% in the monthly chart.
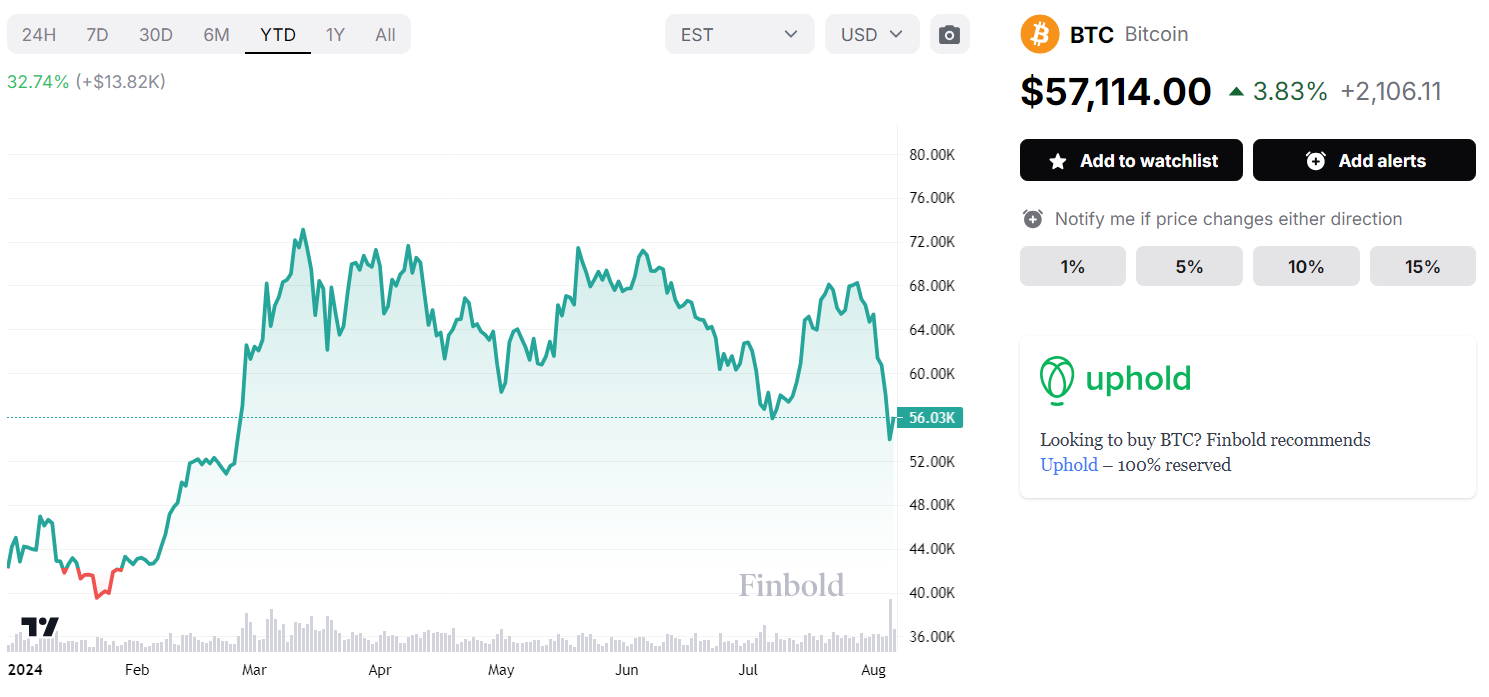
Additionally, the fall in Bitcoin price today, at press time, of $57,114, has done relatively little to dampen the coin’s impressive rise since the start of the year – the rise that amounts to 32.74% by August 7 – or the even more impressive 88.94% 1-year rally.
Disclaimer: The content on this site should not be considered investment advice. Investing is speculative. When investing, your capital is at risk.