The share price of semiconductor giant Nvidia (NASDAQ: NVDA) remains one of the market’s success stories, with consistent gains since entering the artificial intelligence (AI) scene.
Notably, the stock has rallied over 170% year-to-date, but recent technical indicators suggest trouble might be looming for the high-flying equity.
With the price gains, a key technical indicator, the Relative Strength Index (RSI), has shown consistently high values, sparking concerns about the sustainability of the stock’s current price levels and raising questions about a potential imminent crash.
Over the past week, Nvidia’s RSI has persistently hovered at alarmingly high levels, signaling potential overbought conditions in the market. On June 17, the RSI stood at 78.72. A few days prior, on June 14, it was even higher at 80.81.
The June 13, 12, and 11 readings were 79.94, 76.76, and 73.52, respectively. Earlier in the month, the RSI indicated overbought conditions with readings of 75.53 on June 10 and 74.88 on June 7.
Nvidia’s RSI last dipped below the critical threshold of 70 on May 31, when it registered at 68.77.
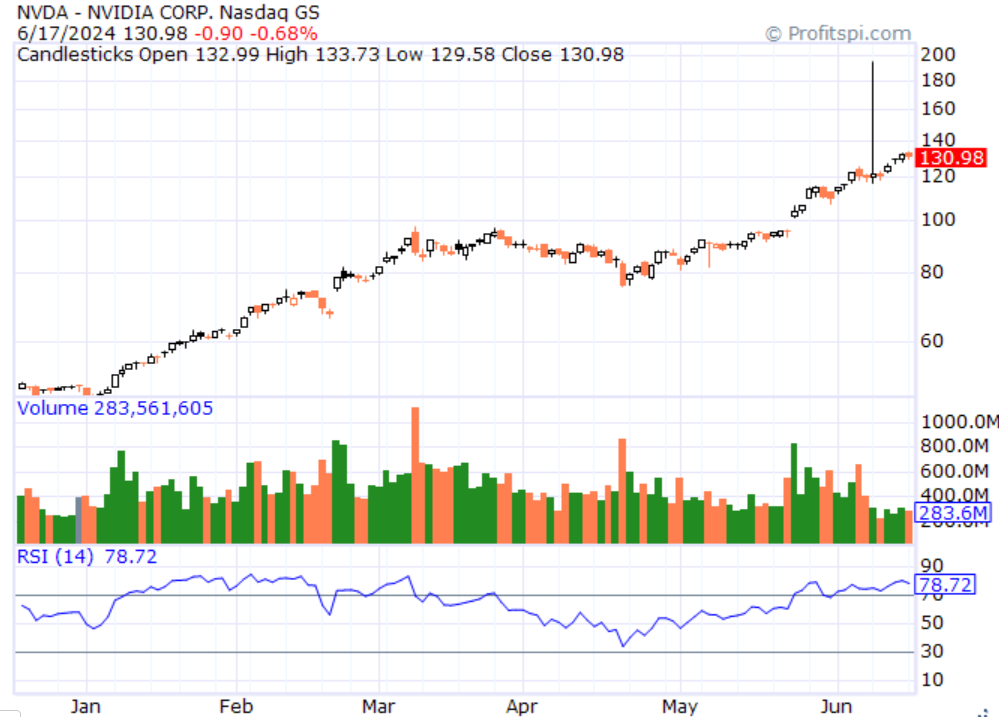
The surge in RSI readings has notably coincided with Nvidia’s implementation of a 10-for-1 stock split on June 7. Since the split, Nvidia’s stock price has appreciated by over 8%, reflecting bullish momentum.
Implication of RSI
Notably, the RSI, a momentum oscillator that measures the speed and change of price movements, is often used to identify overbought or oversold conditions in a stock.
An RSI above 70 typically indicates that a stock is overbought, suggesting a potential for a price correction. Conversely, an RSI below 30 indicates that a stock may be oversold, suggesting it could be undervalued.
Overall, investor sentiment has been overwhelmingly positive, with Nvidia being one of the top-performing stocks in the technology sector. However, the current RSI readings suggest that this optimism may have driven the stock price too quickly.
Analysts forecast Nvidia’s downside
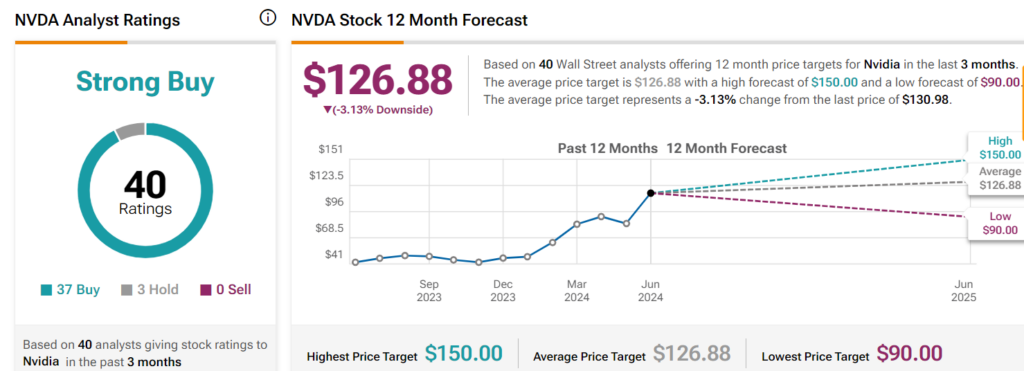
Amid the technical analysis signals, Wall Street analysts at TipRanks are forecasting a downside for the equity. According to the 40 analysts, in the next 12 months, Nvidia will likely see an average price of $126.88, with a high forecast of $150 and a low forecast of $90.
The average price target reflects a 3.13% drop from the equity’s valuation of $130.98 at publishing.
If Nvidia’s stock does experience a correction, it could have broader implications for the tech sector and the overall market, given NVDA’s significant influence, especially in the S&P 500 index.
A previous Finbold report highlighted the impending dangers of this influence by companies such as Nvidia. The report noted that only 30% of S&P 500 stocks have outperformed the index year-to-date, with Nvidia ranking among the top gainers.
Disclaimer: The content on this site should not be considered investment advice. Investing is speculative. When investing, your capital is at risk.