
Bitcoin (BTC) is currently hovering and consolidating above the $70,000 mark, partly buoyed by a slowdown in outflows from spot exchange-traded funds (ETFs). With the cryptocurrency having recently shattered two record highs within days, all eyes are on its potential for yet another historic milestone.
In this regard, TradingShot, a crypto trading expert, shared insights in a TradingView post on March 30. According to the analysis, Bitcoin’s technical indicators strongly point to a bullish immediate price target that could pave the way for a new record high of $78,000.
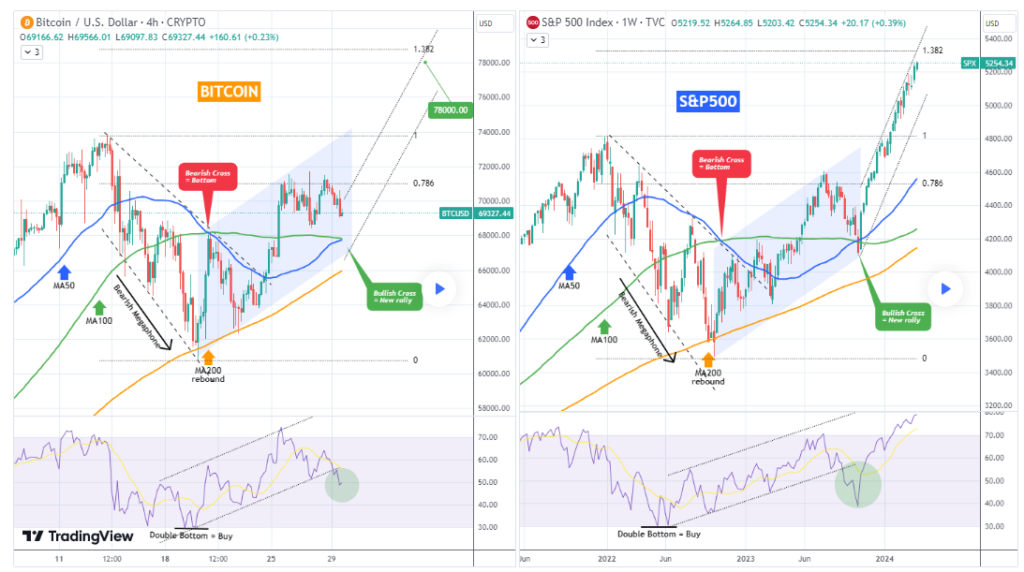
The analyst pointed out that Bitcoin is mirroring a fractal pattern observed in the S&P 500 index, albeit in different time frames. While Bitcoin operates on a four-hour time frame, the S&P 500 analysis is on a weekly time frame.
The analysis notes that Bitcoin is retracing toward its four-hour moving average of 50 (MA50) and is on the verge of forming a bullish cross. The analyst draws parallels with the S&P 500 fractal and suggests that investors should perceive this cross as a significant buy signal. This signal, much like it was for the S&P 500, initiated an aggressive rally that continues to dominate the market.
Additionally, the comparison notes that the asset classes commenced with a bearish megaphone pattern following their respective peaks. Subsequently, they reached and maintained their moving average of 200 (MA200).
Bitcoin overbought territory
From a Relative Strength Index (RSI) perspective, both Bitcoin and the S&P 500 experienced a similar journey, with a channel-up pattern leading them to the overbought territory subsequent to an oversold double bottom formation, which acted as an additional buy signal.
He noted that based on this analysis, Bitcoin is currently in the 0.786 rejection phase. Upon completion of this pullback, the S&P 500 fractal suggests that Bitcoin’s immediate target should hover around the 1.382 Fibonacci extension, culminating in a value of approximately $78,000.
It’s worth noting that Bitcoin is currently maintaining its position above $70,000 after successfully avoiding a dip below the $60,000 threshold. This sustained stability is partly due to reduced outflows from most spot ETFs, coupled with anticipation surrounding the upcoming halving event.
Bitcoin price analysis
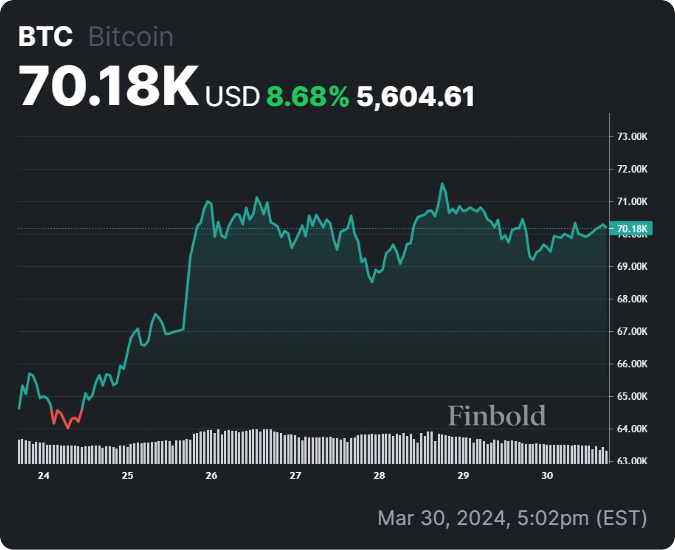
As of the time of writing, Bitcoin was trading at $70,180, marking gains of nearly 9% over the past seven days.
In addition to the factors surrounding the upcoming halving and ETF flows, the current price of Bitcoin remains susceptible to decisions made by the Federal Reserve regarding interest rates.
Disclaimer: The content on this site should not be considered investment advice. Investing is speculative. When investing, your capital is at risk.