In many ways thanks to being an early backer of current-generation artificial intelligence (AI) technology with its extensive cooperation with OpenAI – the creators of ChatGPT – Microsoft (NASDAQ: MSFT) has enjoyed a significant and protracted rise in the stock market.
Indeed, the stock has risen just under 220% in the 5 years since first backing the most famous AI company and even managed to overtake Apple (NASDAQ: AAPL) as the most valuable company in the world in January 2024, boasting – by mid-April – a market cap of over $3 trillion.
More recently, however, MSFT share price appears to have plateaued, and technical analysis (TA) reveals that Microsoft stock’s ascending wedge has been growing ever more narrow with the danger of a bearish breakout becoming ever greater.
Picks for you
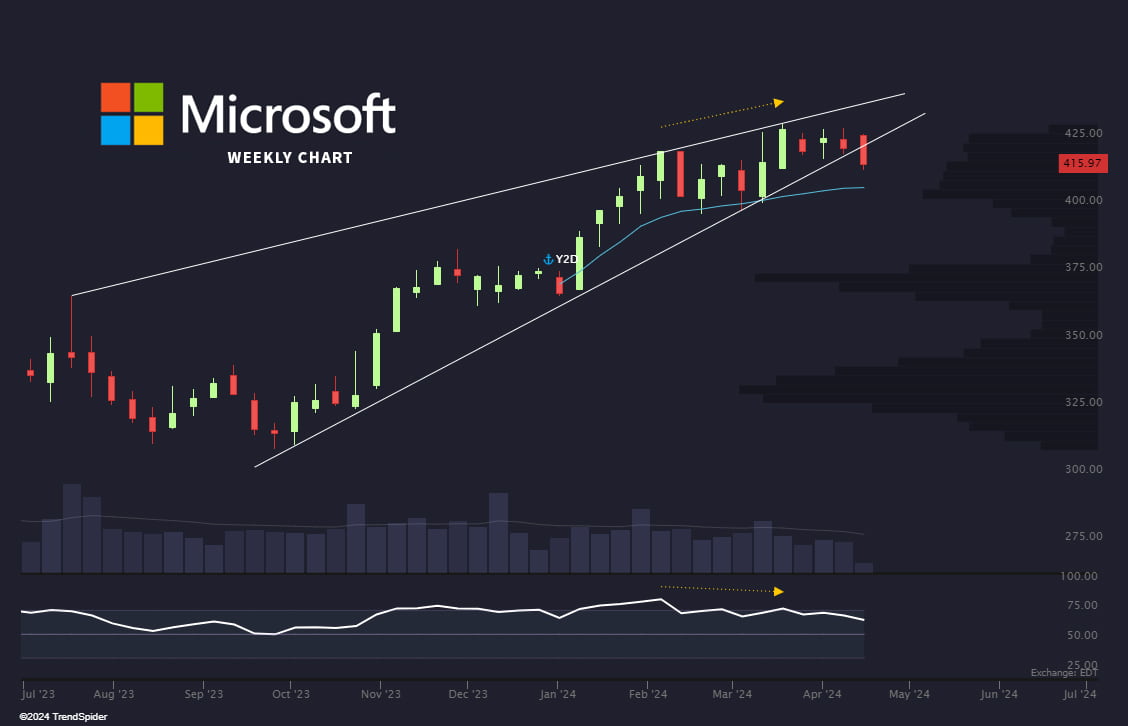
Throughout 2024, $407 has served as the volume weighted average price (VWAP) for MSFT, meaning that a drop below it could indicate that the big tech blue chip has lost a crucial support level, meaning that a fall toward $370 – the farthest of the standard deviation support zones – would become likely.
Before dropping as low – and hitting the VWAP – Microsoft stock has a support zone ranging from 411.32 to 413.63. This zone is formed by a combination of multiple trend lines and important moving averages in multiple time frames.
What is next for MSFT stock?
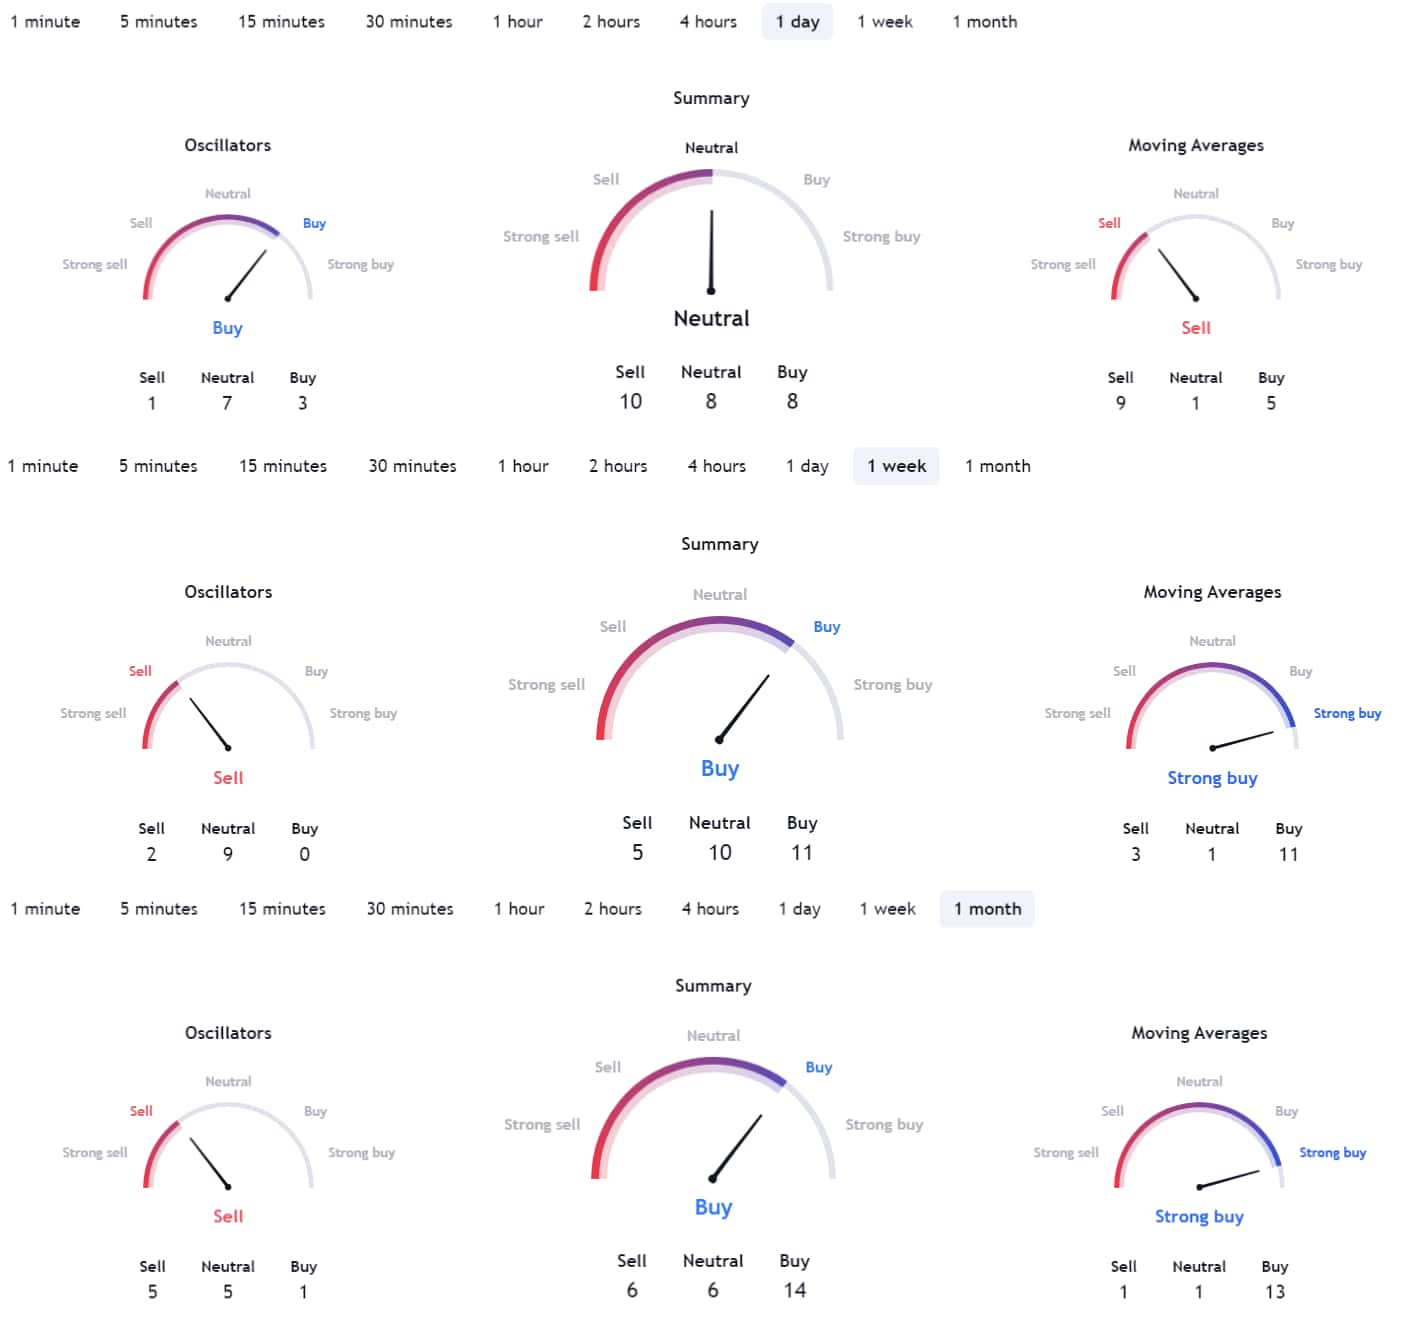
Other technical analysis tools also show a significant level of uncertainty when it comes to Microsoft shares. For example, while the overall rating assigned on TradingView reads ‘neutral’ when based on the daily chart and ‘buy’ when based on the last 7 and 30 days of trading, moving averages (MA) and oscillators in almost all cases diverge significantly.
As things stand on April 17, MA reads ‘sell’ when the latest 24 hours are taken into account but turn toward ‘strong buy’ on both of the longer time frames.
On the other hand, oscillators are bullish in the shorter time frame, but the other two turn their reading into ‘sell.’
MSFT stock price chart
Though its long rally may be near its decisive end, the fact remains that Microsoft has been doing exceptionally well in the stock market in 2023 and 2024 alike.
The last 52 weeks saw MSFT stock rise 43.55%, while year-to-date (YTD) it is 12.28% in the green.
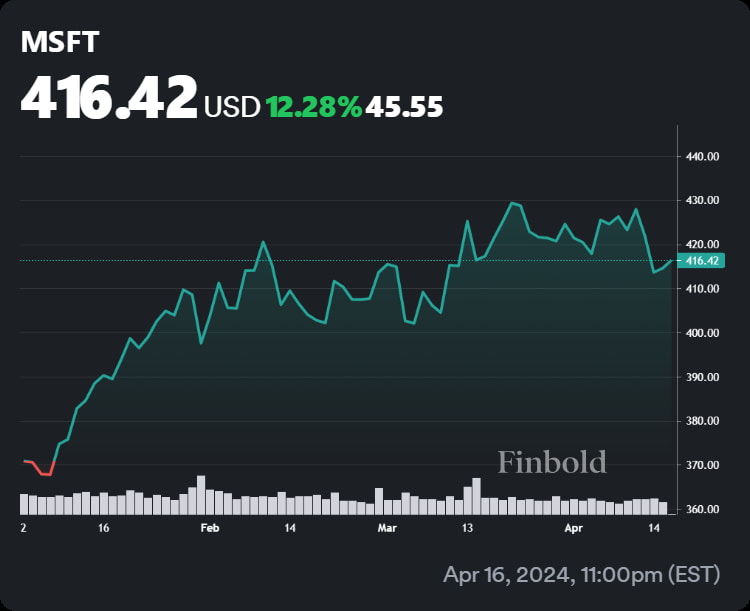
More recent performance has, however, been notably weaker. In the last 30 days of trading, MSFT declined 0.66% while, on the weekly chart, it is down 1.81%.
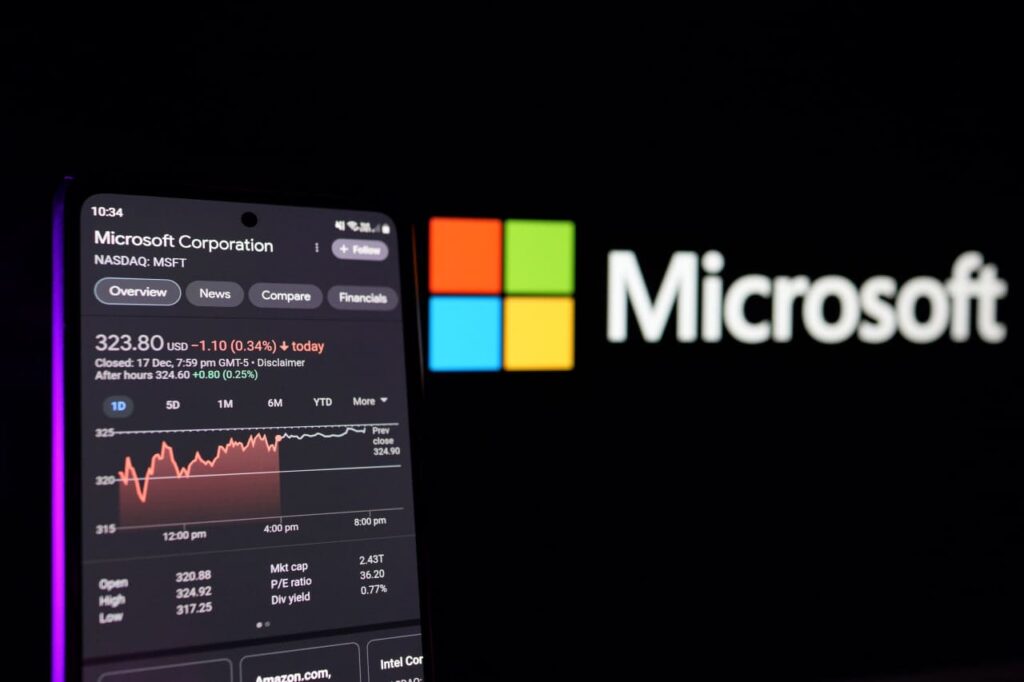
Microsoft price today stands at $416.42 after closing 0.23% in the green on Tuesday, April 17.
Buy stocks now with eToro – trusted and advanced investment platform
Disclaimer: The content on this site should not be considered investment advice. Investing is speculative. When investing, your capital is at risk.