
Although stocks surged during February 2021 amidst the meme-stock craze, the index suffered an 8.4% slump in February 2020 as the COVID-19 pandemic disrupted the global economy.
Over the last three Februaries, stocks ended the month lower twice. Specifically, the S&P 500 saw a decrease of 2.6% in February 2023, and the downturn was more pronounced at 3.1% in February 2022. Given these recent patterns, investors might harbor concerns regarding the stock market’s performance in February.
They say history repeats itself, and if not, it rhymes. Except that in the stock market case, it repeats itself as this sentence, entering a 2-week period that has historically been the worst in the last 100 years.
Historical data over a century reveals a pattern in the stock market performance during the first half of February. Typically, this period is characterized by gains, with an average increase in value of around 1%.
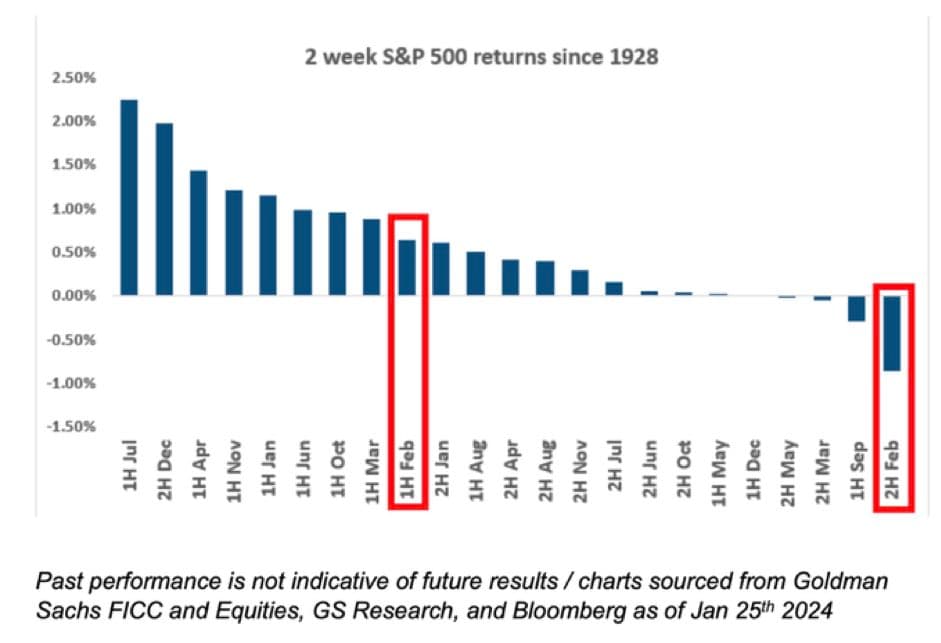
However, the trend shifts in the latter half of the month. Over the last two weeks of February, historically, these gains have often been offset, resulting in a retracement of the stock market value by approximately the same amount.
Concentration of value as a sign of market weakness
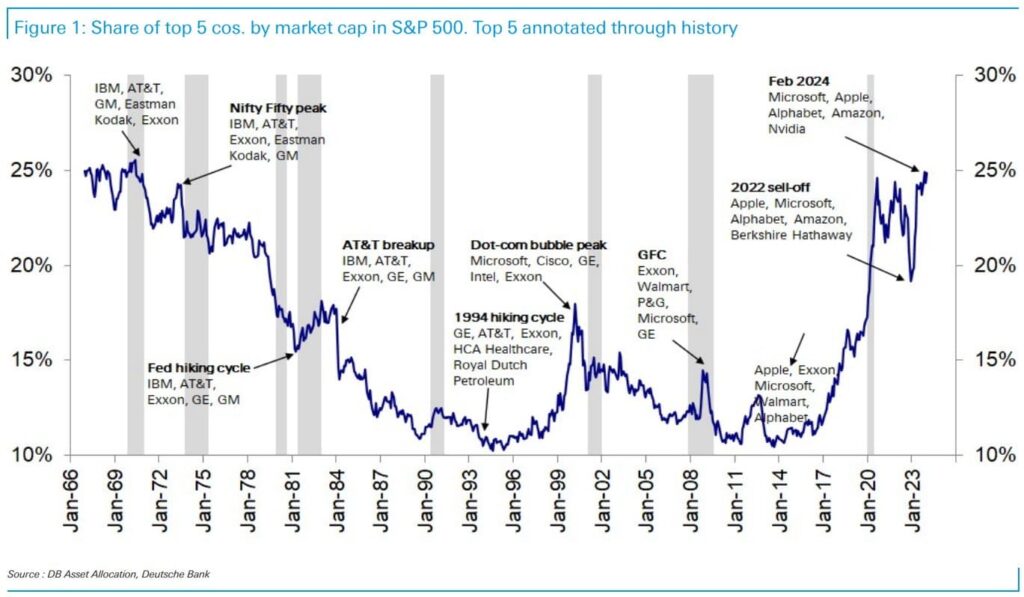
As we delve into historical trends, another intriguing observation arises: the current state of the stock market is reaching concentration levels comparable to those seen in 2000 and 1929.
The top five stocks—Microsoft (NASDAQ: MSFT), Apple (NASDAQ: AAPL), Nvidia (NASDAQ: NVDA), Alphabet (NASDAQ: GOOGL), and Amazon (NASDAQ: AMZN)—now collectively represent 25% of the market capitalization of the S&P 500.
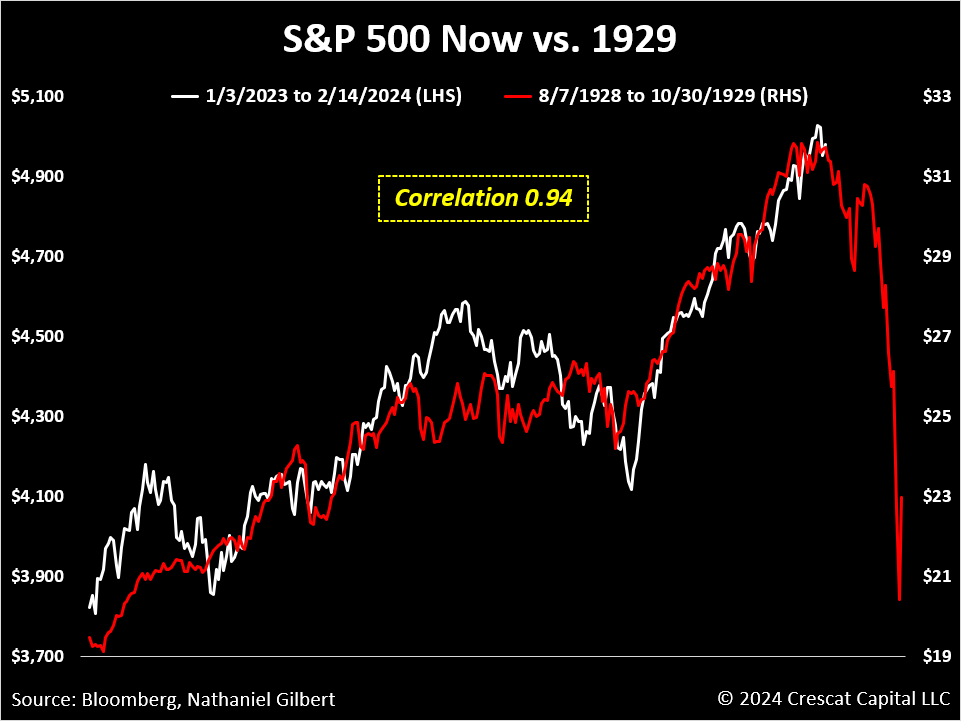
Hedge fund manager Kevin C. Smith, CFA, emphasizes the importance of considering the technical setup of the S&P 500 in relation to that of 1929. He highlights the parallel in valuation and market cap concentration, stressing that these similarities ‘should be top of mind’ for investors, especially given the striking correlation coefficient of 0.94.
The heightened concentration of top-performing stocks in the market exposes it to increased risk, as demonstrated by historical instances where downturns from these key players have dragged down the overall market.
Buy stocks now with eToro – trusted and advanced investment platform
Disclaimer: The content on this site should not be considered investment advice. Investing is speculative. When investing, your capital is at risk.