
Solana (SOL) is currently trading in the red, impacted by a general bearish market sentiment, but an analyst has outlined the token’s potential path to new highs.
Analysis shared by Ali Martinez in a post on X on September 6 indicated that the decentralized finance (DeFi) token has been trading within a parallel channel since April, consolidating its price between defined support and resistance levels.
According to Martinez, Solana’s technical indicators suggest a possible upward movement. Specifically, the TD Sequential indicator, which is used to spot potential trend reversals, signals a possible buy opportunity for the asset, particularly on the daily chart.
The expert pointed out that the indicator appears near the channel’s lower boundary, which is a crucial support level for the cryptocurrency. Therefore, if Solana rebounds from this support, the price could move toward the middle boundary at $154 and potentially the upper boundary around $187.
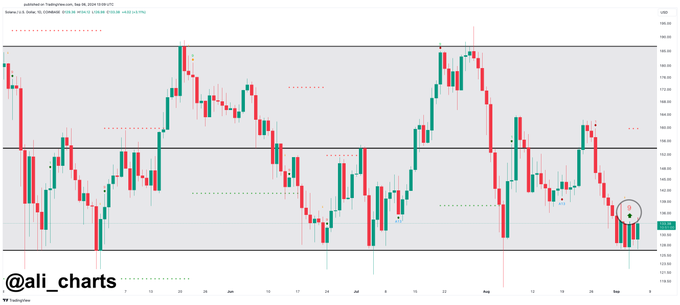
Given the current bearish sentiment, Martinez noted that investors should exercise caution. In his view, if Solana closes below the lower boundary of the parallel channel, currently at $126, it could signal a significant correction in its price. If this bearish scenario plays out, SOL could drop to lower levels of $110 or even $90.
SOL’s key accumulation zones to watch
Another analysis shared by a crypto analyst under the pseudonym Unknown Trader further highlighted SOL’s potential losses. The analyst suggested that the asset could plunge and establish support between $83 and $77.
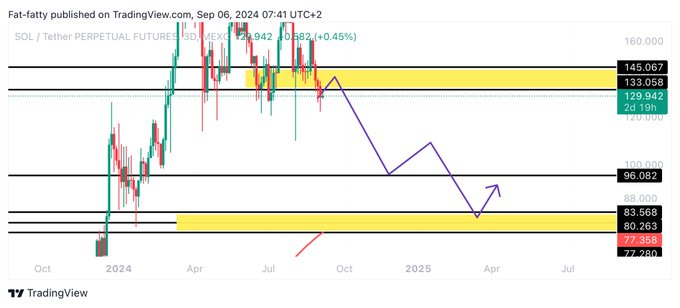
According to this analysis, the zone represents an accumulation area where buyers may step in to defend the price. Notably, this region has historically seen buying interest, and if sustained, it could lead to a rebound in early 2025.
Failure to hold this zone could see SOL breaking down further, testing the $77 level or lower, potentially prolonging the bearish sentiment. Conversely, strong demand around these levels could spark a recovery towards $96 or higher.
SOL price analysis
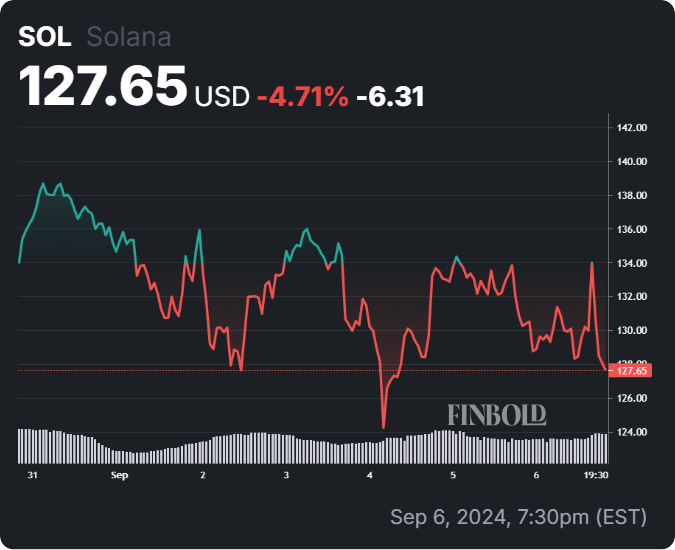
As of press time, Solana was trading at $127, having declined by over 2% in the last 24 hours. Over the past week, SOL is also down nearly 5%.
A summary of the current trading activity indicates that SOL is trading below its 50-day and 200-day simple moving averages (SMAs), signaling a bearish trend extending in the short and long term.
While Solana’s 14-day relative strength index (RSI) is not yet in the oversold territory (generally defined as an RSI below 30), it is nearing that level. An RSI in this range suggests that selling pressure has been dominant but not extreme. If the RSI drops further, it might indicate an oversold condition, potentially triggering a reversal or price bounce as buyers seek to capitalize on the lower price.
Disclaimer: The content on this site should not be considered investment advice. Investing is speculative. When investing, your capital is at risk.