
Crypto traders are turning to technical analysis (TA) to look for indicators of what awaits the largest digital asset – Bitcoin (BTC) – in the near future as the broader cryptocurrency sector continues to struggle below the $1 trillion psychological mark.
One indicator, in particular, the Relative Strength Index (RSI) and Bitcoin’s 3-day RSI is currently showing a pattern of increase which, together with its price action, is indicating a sharp selling pressure for the flagship digital asset, as presented by technical analyst Matthew Hyland on October 16.
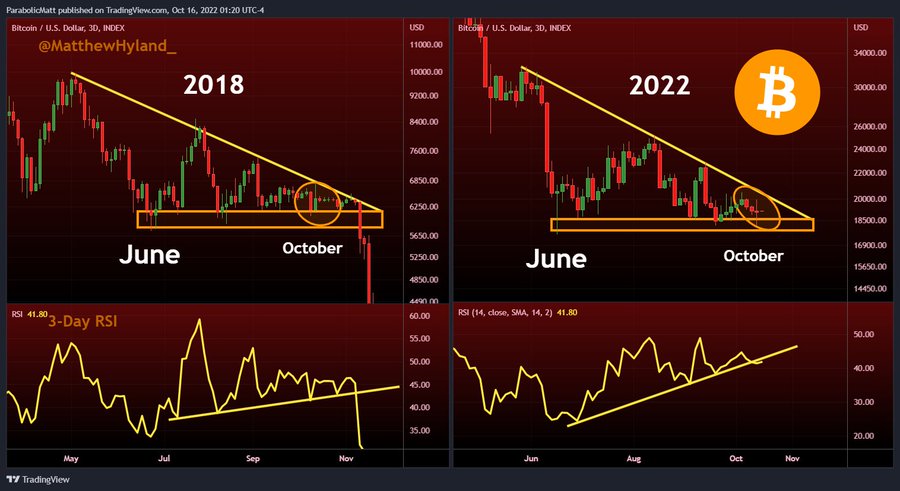
Indeed, the RSI metric, which is a momentum indicator observing the magnitude of the latest price fluctuations to determine whether the value of a token is overbought or oversold, is currently moving toward the overbought line (above 70), acting as a signal to traders to sell, should it cross.
Additionally, as the overbought condition can also be viewed on a stochastic oscillator, a sell signal is provoked once the oscillator reading goes above 80 and returns to readings below 80.
2018 vibes?
According to Hyland, Bitcoin’s present activities remind of those at roughly the same period in 2018, when its 3-day RSI also recorded increases, in conjunction with the descending triangle in October, a bearish pattern traditionally taken as a signal for taking short positions.
In technical analysis, such activities are referred to as a negative RSI reversal, also known as a ‘bearish divergence’ and another massive sell signal for traders (as opposed to ‘bullish divergence’).
Back in 2018, the decentralized finance (DeFi) asset’s similar pattern of activities was followed by a dramatic price drop of more than 50% – from $6,600 in October to a low of $3,244 in December.
More bad news?
Meanwhile, crypto trader and analyst Josh Rager noted a bouncing ball pattern matched up with a rally, voicing his view that this doesn’t spell much hope for Bitcoin in the near future, but that its historical correlation with the stock market could still offer some change, as Finbold reported.
As things stand, Bitcoin is currently trading at $19,361, up 1.11% on the day, as well as 0.22% across the previous seven days, as per CoinMarketCap data retrieved on October 17.
Disclaimer: The content on this site should not be considered investment advice. Investing is speculative. When investing, your capital is at risk.