
Bitcoin (BTC) has been consolidating for over two months, with technical indicators suggesting the cryptocurrency may soon test key resistance levels, potentially paving the way for a breakout.
Notably, an analysis by TradingShot highlights that BTC has been consolidating within a ‘Rectangle’ pattern, displaying remarkable technical symmetry, which could help trace its next move.
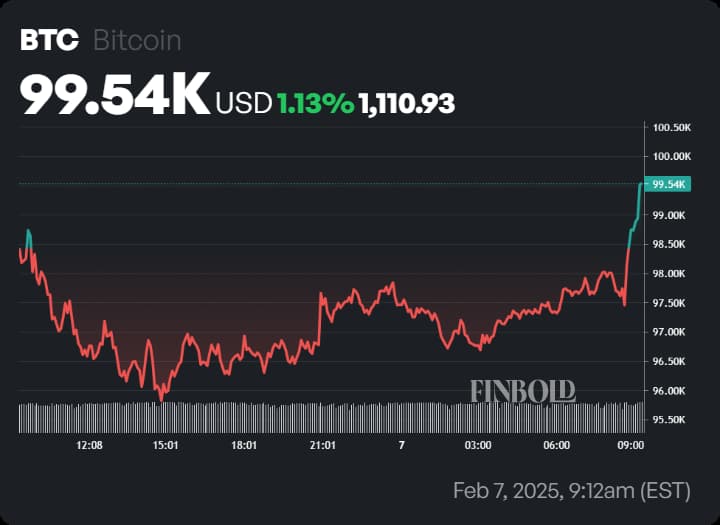
At press time, BTC is trading at $99,543, with a one-day gain of 1.13%. Despite its year-to-date gain of 3%, Bitcoin’s price has remained range-bound for over two months, between $91,500 and $106,500, signaling ongoing consolidation.
While Bitcoin hit a year-to-date high of $109,000 on January 19, it has since retraced, struggling to sustain momentum above its recent peak
Technical symmetry indicates a potential BTC rally
According to the analysis, Bitcoin recently broke above a key Lower Highs trendline after rebounding from its February 3 low near the Rectangle’s lower boundary.
Each time BTC has made this move within the current consolidation phase, it has triggered a rally toward the Higher Highs trendline, strengthening the potential for further upside.
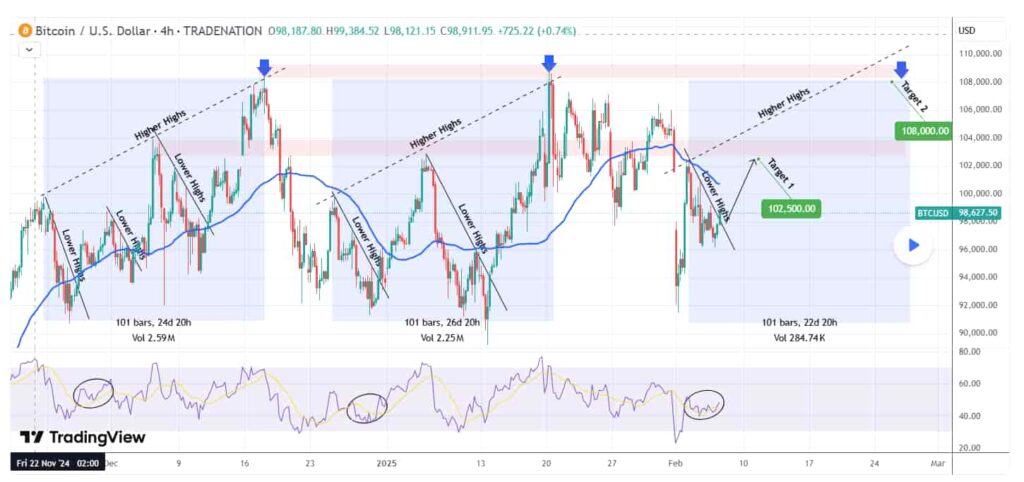
Moreover, the analyst also notes that from the first high to the last high within this structure, BTC followed a consistent cycle of 101 four-hour candles.
If this pattern holds, the current upward move, which started on February 3, could see BTC reaching the top of the Rectangle by February 26, aligning with the previous symmetrical trends.

“It is interesting to mention that so far the range from the first High to the last High of this trend line has been 101 4H candles (roughly 25 days). Since on the new (blue) phase that started on February 03 High, we had our first, we can expect it to conclude near the top of the Rectangle by February 26.”- the analyst noted.
Bitcoin’s short-term price targets
Based on the analysis, the first short-term price target for Bitcoin is $102,500, aligning with Symmetrical Resistance Zone 1. This level has historically acted as a key resistance point, making it a critical level to watch.
The second target is at $108,000, which represents the top of the Rectangle pattern and aligns with Symmetrical Resistance Zone 2. A breakout above this level could confirm a trend reversal, potentially positioning BTC for a larger rally beyond its current range.
What’s next for Bitcoin?
Echoing the bullish outlook, analyst Arjantit suggests that Bitcoin’s consolidation cycle is nearing its end, potentially setting the stage for a rally toward $120,000 in the coming weeks.
However, not all analysts share this optimism. Market uncertainty has intensified following U.S. President Donald Trump’s tariff threats, which triggered massive crypto liquidations and fueled concerns over a potential trade war.
As a result, some experts caution that Bitcoin could remain range-bound for a longer period, with macroeconomic factors adding further volatility to its trajectory.
Featured image via Shutterstock