As XRP investors anticipate a possible rally in the token, a trading expert is suggesting there might be more downside ahead before any rally.
In this line, crypto analyst Trading Shot, in a TradingView post on August 11, stated that XRP is showing signs of continued decline based on the token’s daily timeframe. The analysis highlights several key indicators pointing toward a bearish outlook.
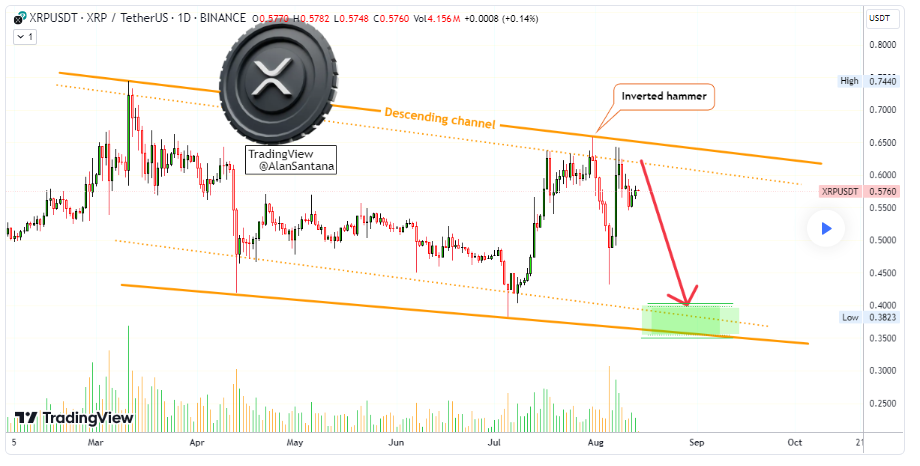
The primary signal is a descending channel characterized by lower highs and lower lows. This pattern is typically associated with a bear market, suggesting that XRP is likely to continue its downward trend.
A significant event noted in the analysis is the formation of an inverted hammer just before the major drop leading to August 5, when the token dropped to $0.43. An inverted hammer is a candlestick pattern that often hints at a potential reversal or pause in the market trend. However, in this case, the pattern was followed by a brief bounce that resulted in a lower high, reaffirming the bearish bias.
The analysis adds that XRP remains in a bearish phase on the daily timeframe. The lower high after the August 5 drop indicates that the market sentiment has not shifted, and the descending channel continues to guide the price action.
XRP’s next low target
According to the prediction, traders should expect a lower low in the next drop compared to the one observed on August 5. The lower trendline of the descending channel can serve as a guideline for where XRP might head next. If the current trend continues, XRP could be headed toward a new low, targeting the range between $0.35 and $0.40, according to the expert.
“Expect a lower low on the next drop compared to 5-Aug. The descending channel lower trendline can be used as a guideline,” the expert stated.
Despite the analyst’s bearish prediction, the overall sentiment in the market is that the token is bound to rally significantly in the long term. Notably, the optimism emanates from a positive legal ruling that hinted at minimal chances of XRP being reclassified as a security in the Ripple and Securities Exchange Commission (SEC) case.
For instance, as reported by Finbold, another crypto analyst suggested that XRP is likely to trade at $60 in the near future, noting that the token is backed by favorable trends in the Moving Average Convergence Divergence (MACD) indicator and critical support and resistance levels.
XRP price analysis
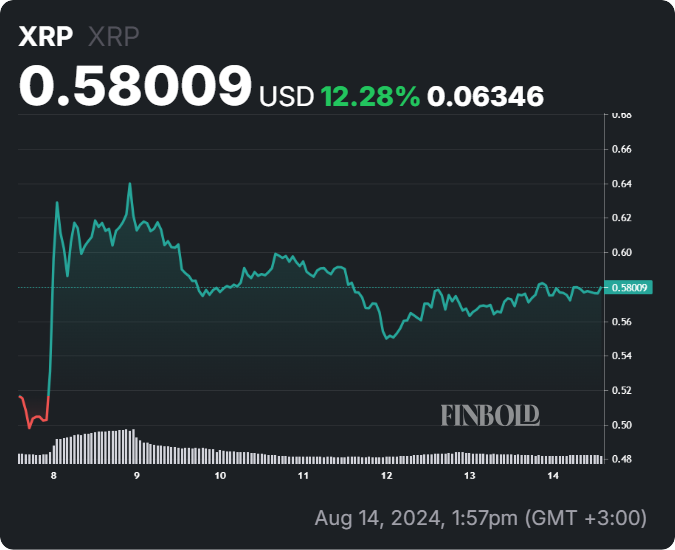
As things stand, XRP is changing hands at $0.58, having made minor gains of less than 1% in the past 24 hours. At the same time, on the weekly timeframe, the token is up over 12% as it seeks to reclaim the $0.62 recorded in the past seven days.
Meanwhile, whether XRP bulls or bears take over, the $0.60 zone remains crucial, as reclaiming it could signal possible bullish momentum. Therefore, breaking the down trendline would invalidate the bearish analysis and potentially start a bullish reversal above $0.60 resistance.
Disclaimer: The content on this site should not be considered investment advice. Investing is speculative. When investing, your capital is at risk.