
Despite the slowdown of the 2023 electric vehicle (EV) market, Tesla (NASDAQ: TSLA), led by Elon Musk, exhibited resilience in its growth. The company adjusted pricing strategies in response to diminished demand, distinguishing its success.
Over the year, Tesla achieved a new milestone in vehicle deliveries. Despite encountering some obstacles, the company successfully unveiled its highly anticipated Cybertruck, which led to its stock rising by more than 60% in the last year.
However, the start of 2024 brought losses for TSLA as it lost -11.89% of its price since it commenced and -13.65% in the past 30 days.
These different performances prompted Finbold to utilize advanced AI predictions on January 15 to see where this stock might end up trading by the end of this year.
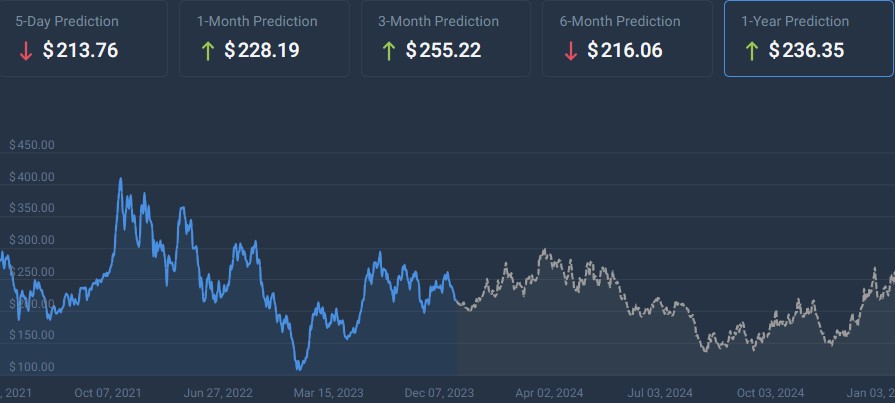
The AI algorithms predict a slight increase for its stock to a price of $223.49, representing a 2.10% upside from the current price of $218.89 at the time of writing.
Analyst sees a potential make-or-break situation
With the current disparity in performance from last year, the price chart of TSLA stock has formed an interesting pattern that drew the attention of analysts.
The current week represents a pivotal moment for the inverse head and shoulders setup of Tesla, essentially determining its success or failure, as per a post on X from stock analyst Jake Wujastyk on January 15.
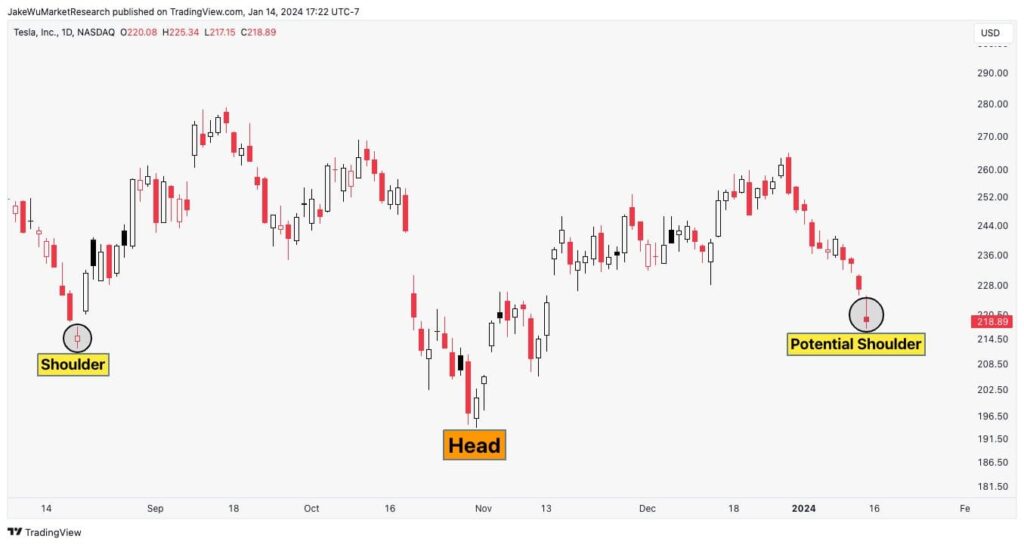
The inverse head and shoulders pattern, within the realm of technical analysis, indicates a potential reversal in a downtrend.
Its formation is characterized by the asset’s price establishing a low (referred to as the “left shoulder”), succeeded by a lower low (termed the “head”), and subsequently, a higher low (designated as the “right shoulder”).
This means this pattern might reverse and bring gains to this stock or continue downwards, beneath its support level.
TSLA stock price analysis
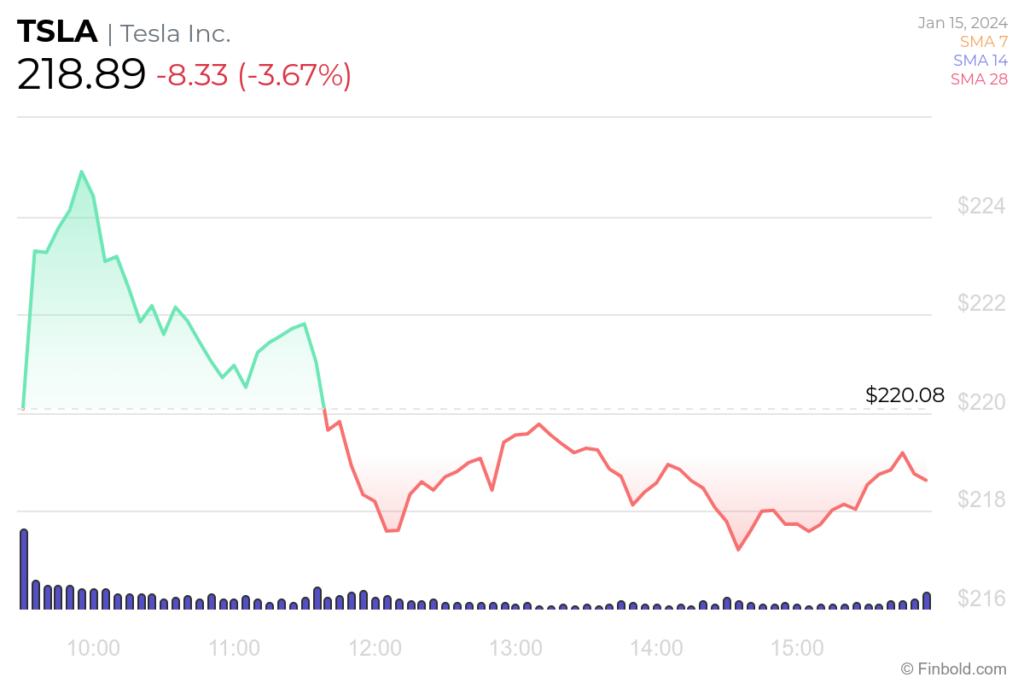
At the time of writing, TSLA stock price stood at $218.89, indicating a decrease of -3.67% from the previous closure on January 12, losing -7.32% in the last 5 sessions.
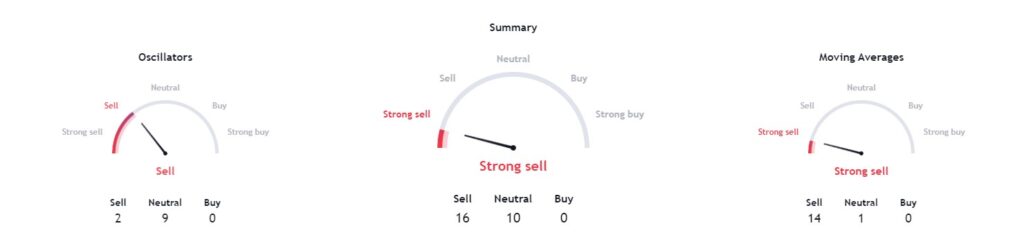
The technical indicators are also quite bearish, with a consensus of ‘strong sell’ at 16 and moving averages at 14. Meanwhile, oscillators indicate a ‘sell’ at 2.
Whether TSLA stock will be able to replicate 2023 or this year will be a period of losses and opposite performance remains to be seen.
Buy stocks now with Interactive Brokers – the most advanced investment platform
Disclaimer: The content on this site should not be considered investment advice. Investing is speculative. When investing, your capital is at risk.