As Solana (SOL) continues to show potential for sustained bullish momentum in its quest to reclaim the $200 resistance level, an analyst has projected that Solana is poised for a potential breakout.
Notably, crypto trading expert RLinda has highlighted that despite recent volatility triggered by macroeconomic factors such as the U.S. unemployment rate and profit-taking activities, Solana has been navigating a period of consolidation within a significant bullish trend.
In her technical analysis, RLinda outlined a clear roadmap for Solana, projecting its journey from the current levels of around $147 to a target of $205.
Technical analysis and key levels to watch
The analysis of Solana’s chart pattern reveals critical insights into its current price action and potential future movements, particularly through the lens of both daily and weekly time frames.
The daily chart shows that Solana is in a consolidation phase within a well-defined triangle formation, a pattern that typically indicates the continuation of an existing trend, which, in this case, is bullish.
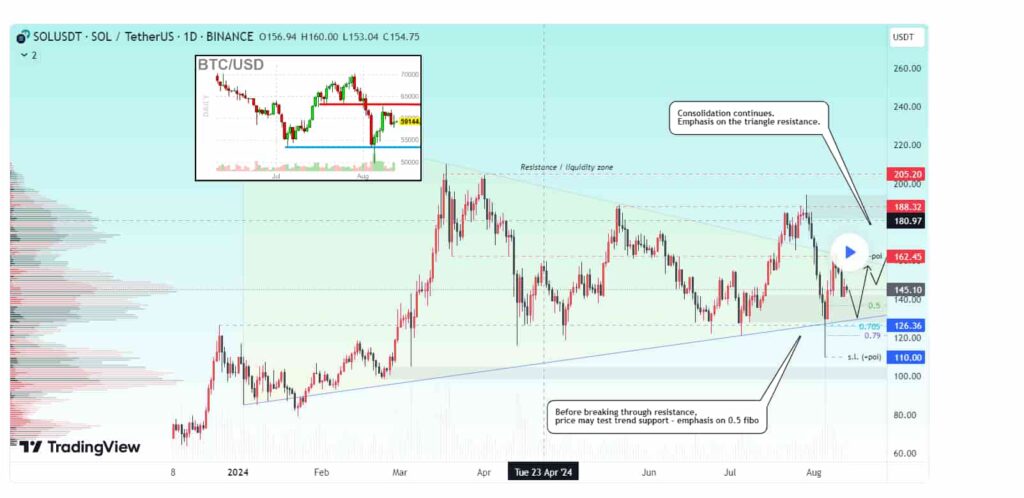
The price has been oscillating within this triangle, with the upper boundary at the $162.45 resistance level acting as a significant hurdle for further upward movement. A breakout above this resistance could signal a strong bullish continuation.
Support levels at $141.20, $136.70, and $126.40 are also crucial for understanding the strength of any potential pullback or correction.
The 0.5 Fibonacci retracement level around $137 suggests that a correction might occur before an upward breakout, offering a potential buying opportunity within this retracement zone.
Additionally, the volume profile indicates that substantial trading activity within this range has created liquidity zones that could either support or resist future price movements.
Solana long-term targets
On a broader scale, the weekly chart provides further context by highlighting a larger triangle pattern that has been forming over several months.
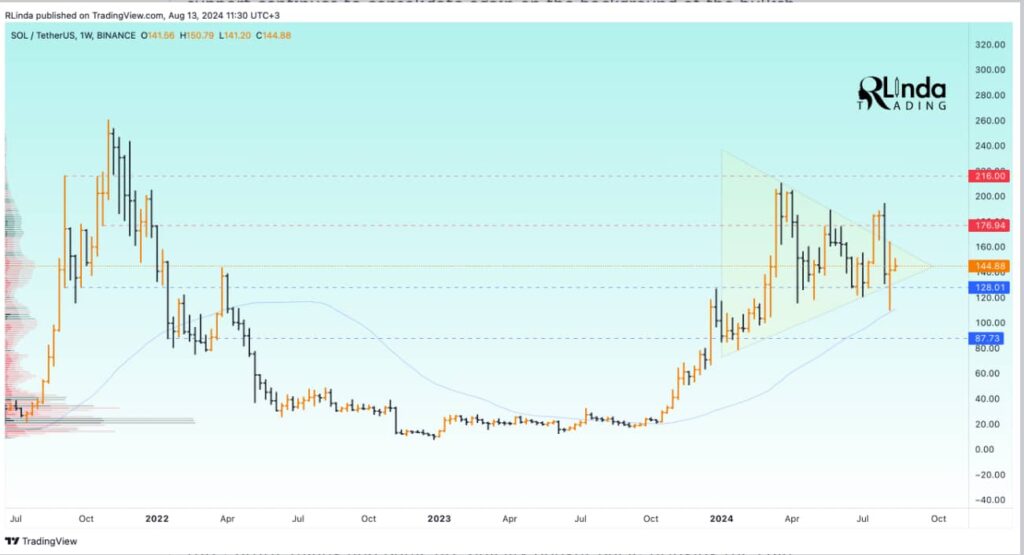
This pattern aligns with the analysis from the daily chart, emphasizing the importance of the $162.45 resistance level. The global bullish trend remains intact, and despite short-term fluctuations, the long-term outlook for Solana is upward.
The next significant resistance levels are identified at $188.32 and $205.20, which could become the next targets if the price successfully breaks out from the current consolidation phase.
The $128.01 support level is also noteworthy, providing a strong foundation if the price were to test lower levels before making a move upwards.
Solana price analysis
As of press time, Solana was trading at $144.84, reflecting a decline of approximately 0.24% in the last 24 hours. On the weekly chart, the asset has declined by over 1.5%.
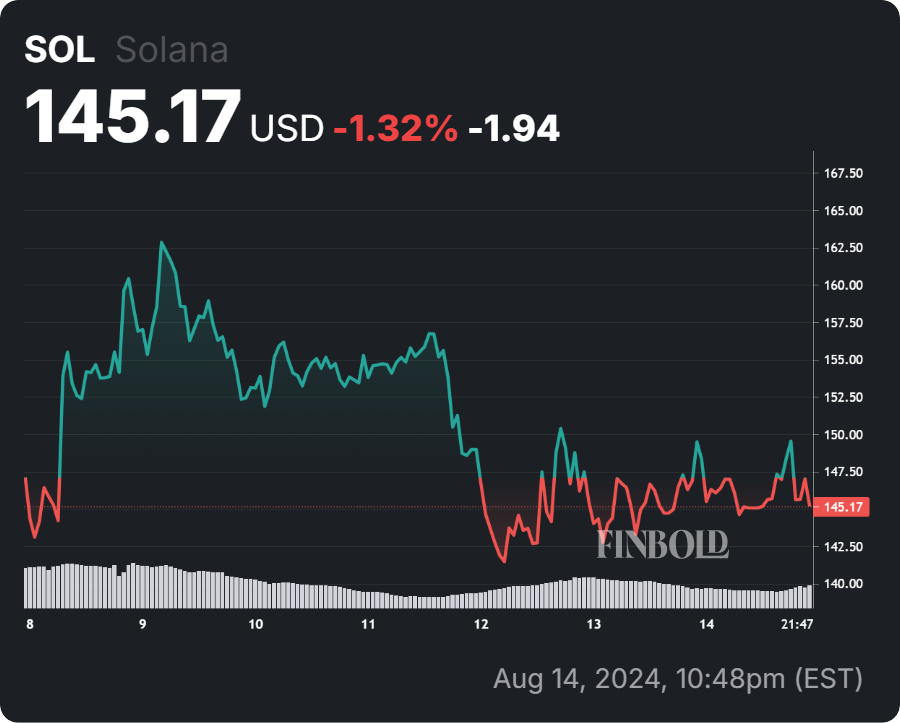
Solana’s bullish triangle pattern and key resistance level at $162.45 suggest it’s well-positioned for further gains. A breakout could drive the price higher, making Solana a promising asset to watch closely.
Disclaimer: The content on this site should not be considered investment advice. Investing is speculative. When investing, your capital is at risk.