Apple (NASDAQ: AAPL) is expected to post its third consecutive quarterly revenue drop on Thursday, August 3, after market close.
Wall Street expects $81.7 billion in sales, down 2.3% from last year.
The April-June quarter is typically slow for iPhone sales as shoppers wait for a new model release in the fall. iPhone sales weakness is expected to come from the Americas, while China sales are expected to be flat. The weakness is likely to be offset by iPhone sales in India, according to Piper Sandler analysts.
iPad and Mac sales are expected to drop by about 10% each, according to FactSet estimates. But Apple’s App Store, its streaming services, as well as its “wearables, home and accessories” category could offset the losses.
Wall Street expects strong growth in services
Apple’s Services include Apple Music, fees from the App Store, ad revenue from Google, as well as Apple Pay fees and other products.
Analysts like to see the service business grow more than the expected 5% in revenue year-over-year. That’s more than $20 billion, according to FactSet.
Apple silently joins the AI race
Apple has avoided many of the buzzwords this year like AI and virtual reality, but the company is slowly building in these two niches. Apple already tests its own large language model, called “Ajax” to challenge ChatGPT.
The company’s processors already support neural networking capability, which can offer “investors exposure to future AI trends,” according to TD Cowen analyst Krish Sankar.
With the addition of Vision Pro to its future product line, analysts will expect to see an update on Apple’s AI aspirations.
Analysts set price AAPL targets north of $200
Nine analysts reiterated or maintained their bullish ratings before the earnings report. Only two of them have a target price below $200, the most conservative being $190 from UBS.
The most bullish price target is $235 from JPMorgan.
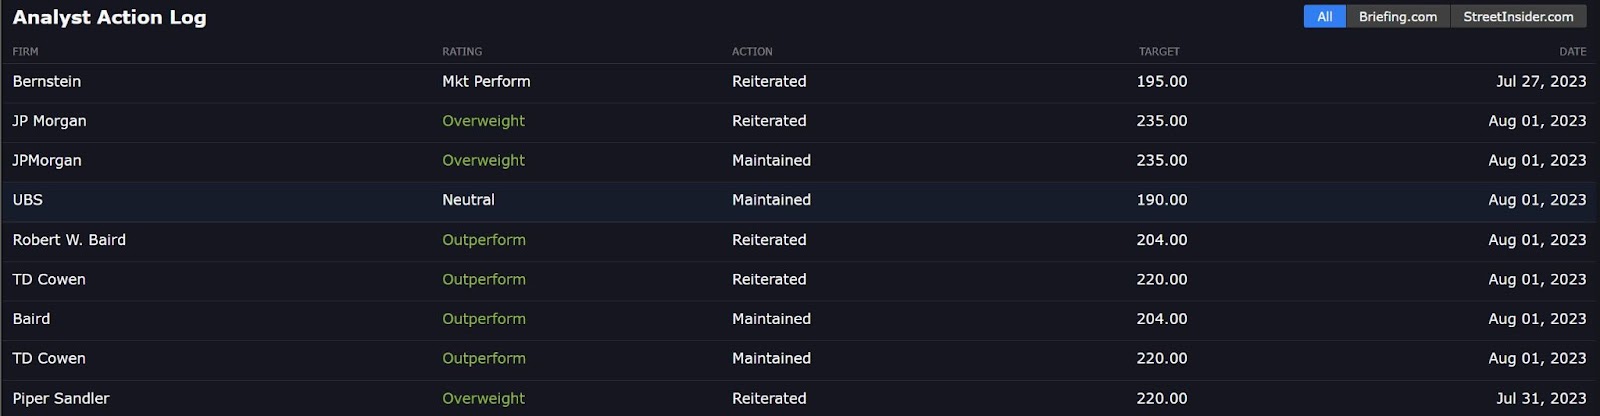
Source: Interactive Brokers Fundamentals Explorer
AAPL stock technical analysis
The daily AAPL chart is nothing but a long ascending channel pattern starting from March of this year. This price can break out of the channel either on the top side or the lower, which is why traders typically wait for the break out before entering a trade.
The top of the channel coincides with the $200 resistance level, meaning a strong catalyst is needed to propel the price higher.
A break out on the lower side, though, could pull the price back to $175, which is the support level.
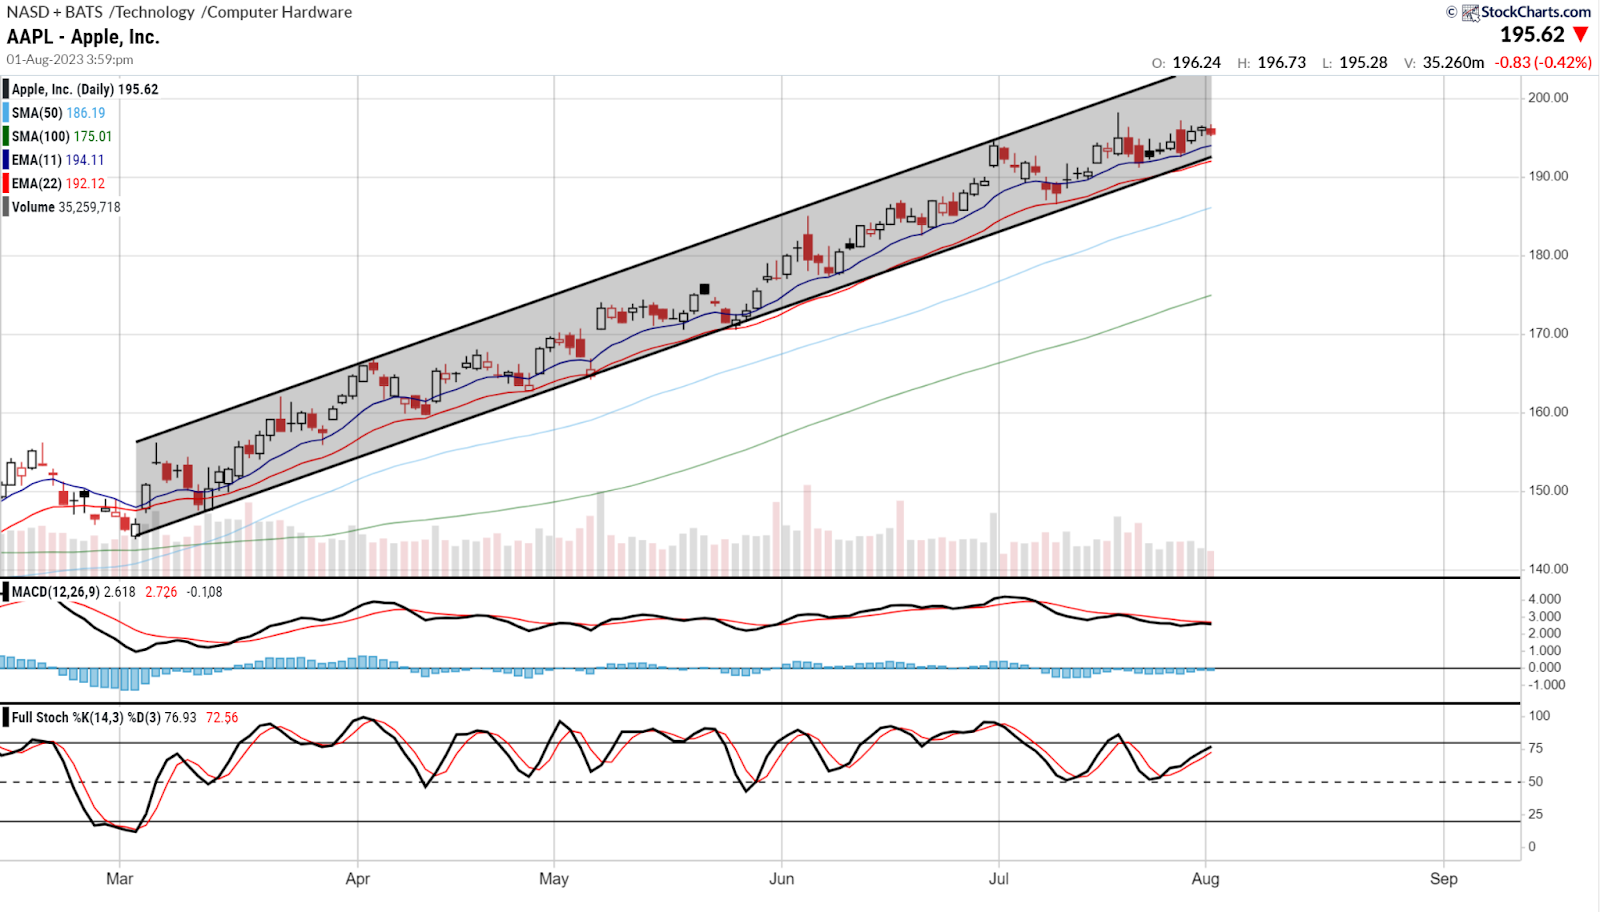
AAPL stock daily price chart. Source: StockCharts.com
Apple is already up 56% year to date, outperforming S&P 500 at 19%. Given that Apple is a strong defensive play with a large cash position and growing product lines and services, any pullback could present a good entry point for the long run.
Buy stocks now with Interactive Brokers – the most advanced investment platform
Disclaimer: The content on this site should not be considered investment advice. Investing is speculative. When investing, your capital is at risk.