
The cryptocurrency sector continues to struggle below the $1 trillion market capitalization, with its largest digital asset – Bitcoin (BTC) – itself trying to keep its head above the $20,000 price level, leading traders and investors to try and discern what comes next.
As it happens, Bitcoin is close to reaching almost a year-long downtrend on the weekly timeframe, according to a chart and analysis tweeted by pseudonymous crypto trading expert Rekt Capital on October 4.
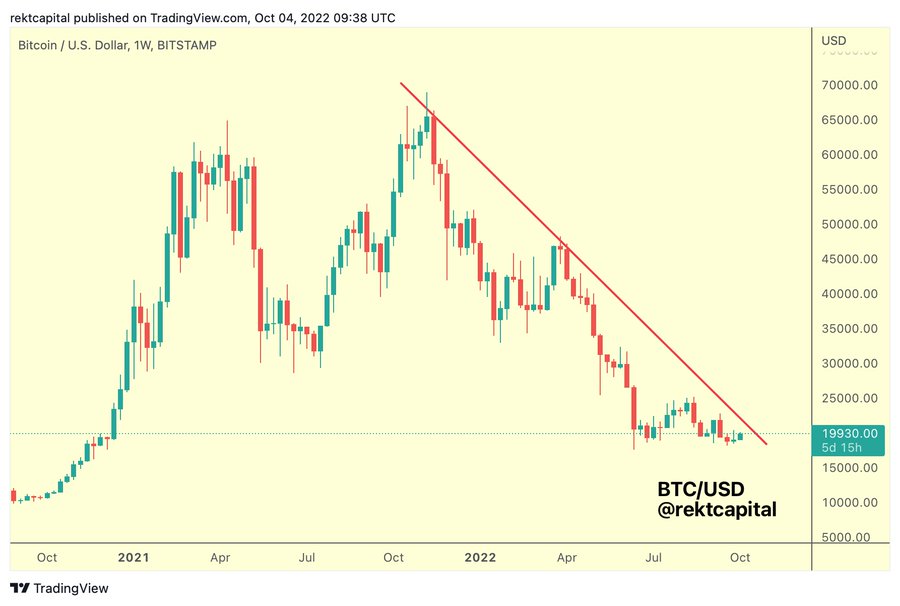
Indeed, Rekt has noted in the technical analysis the downward pattern on the flagship cryptocurrency that began around November 2021 and has continued ever since, with a couple of exceptions over time, the most noticeable being in April 2022.
In another tweet, the analyst noticed the recent compression of the price of Bitcoin, which he believes could lead to volatility due to historical behavior in such cases:
At the same time, prominent crypto expert Michaël van de Poppe observed that Bitcoin was “consolidating in between levels,” predicting “resistance at $20.7k for scalp shorts, otherwise $22.4K seems next.”
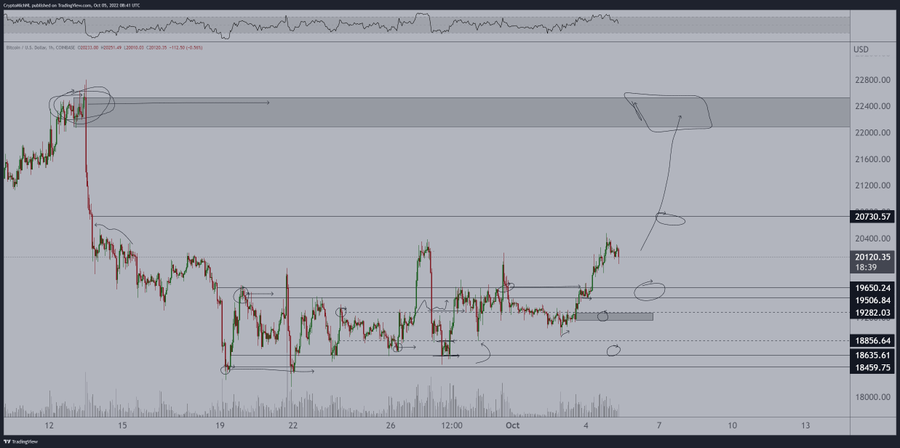
According to Van de Poppe, the “area for longs is at $19.6K,” which he considers interesting, although he expressed doubt that such a thing would happen.
Other indicators are positive
That said, Bitcoin has witnessed increases elsewhere, particularly in the number of its holders, which has been steadily rising, adding 4.5 million new holders over the year leading up to September 27, as investors kept turning to Bitcoin as a store of value.
On top of that, Finbold reported in September that 47% of Bitcoin holders were still in profit, despite the decentralized finance (DeFi) token’s 60% price drop in 2022, indicating that the current bear market hasn’t put them off.
Investors’ confidence is also illustrated in the greater quantity of Bitcoin being removed from crypto exchanges, with less than 9% remaining there – another four-year low – indicating that investors are going into the ‘HODL’ mode.
Bitcoin price analysis
At press time, Bitcoin was trading at $20,149, up 0.99% on the day, as well as growing by 7.59% across the previous seven days. Over the year, the price of the flagship digital asset has decreased by 63.63%.
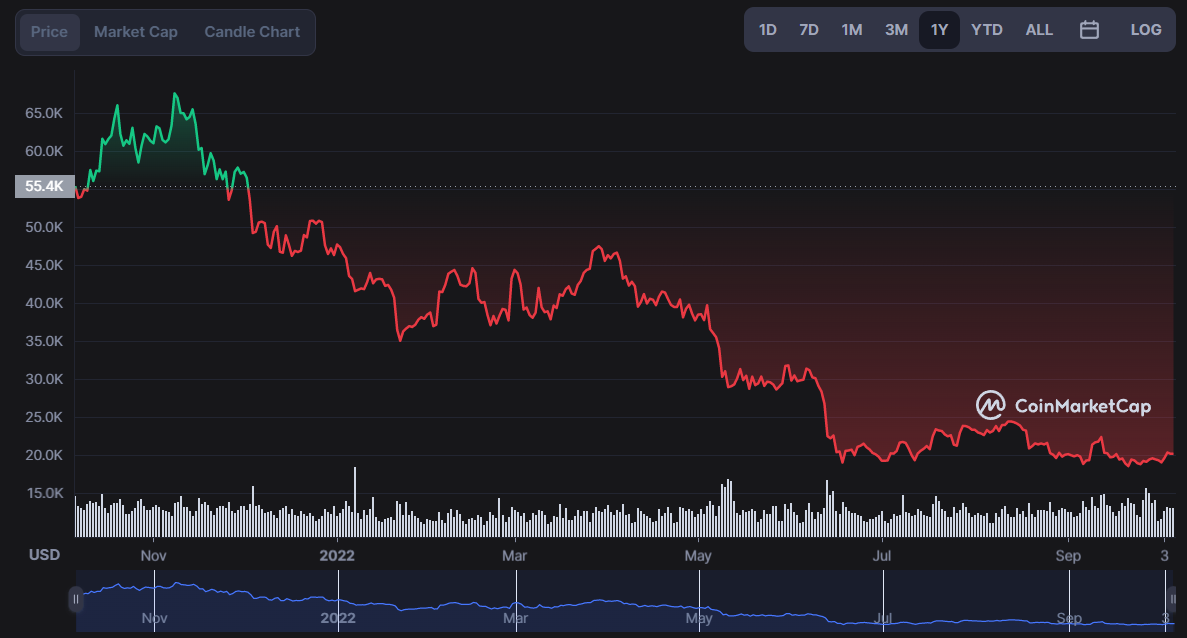
Meanwhile, the market capitalization of the maiden digital asset currently stands at $387.34 billion, as per CoinMarketCap data retrieved by Finbold on October 5.
Disclaimer: The content on this site should not be considered investment advice. Investing is speculative. When investing, your capital is at risk.