
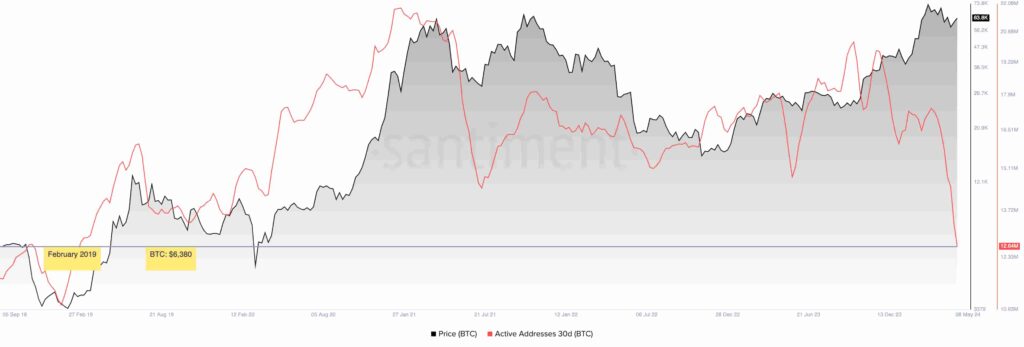
The Bitcoin (BTC) network activity has dropped to lows previously seen in February 2019, five years ago. At that time, BTC was trading at $6,380 – ten times lower than its current price of $63,800.
Finbold retrieved premium data from Santiment on May 15, which shows a 5-year low count for Bitcoin’s 30-day active addresses. Essentially, this metric looks at the number of distinct addresses participating in a transaction in the last 30 days. Each address is counted only once for the window and represents the overall network activity in a given period.
Notably, the Bitcoin network registered 12.64 million active addresses in this window, a count previously seen in February 2019. BTC was trading at the $6,380 price level with massive volatility in the final phases of a bear market.
Interestingly, July 2021 had a similar network activity drop to 14.50 million right after last cycle’s first top at nearly $65,000—happening at the same time as a 50% price crash hit BTC, driving the asset to below $30,000.
Why does Bitcoin network activity matter?
There are a few possible insights to get from Bitcoin’s network activity, not necessarily related to price action. Nevertheless, the above chart suggests a direct correlation between the 30-day count of active addresses and the BTC price.
Overall, higher network activity indicates a higher demand from unique peers to use Bitcoin for value transfer. Satoshi Nakamoto described Bitcoin as a “peer-to-peer electronic cash system.” Thus, higher demand for that use could suggest the tool is delivering its promise and attracting new users for that.
Conversely, a lower network activity at surging prices could raise doubts about where Bitcoin’s market demand is coming from. Moreover, it could put this demand’s health in check if it comes mostly from derivatives speculation rather than organic use.
BTC price analysis
From another perspective, lower network activity means fewer addresses have withdrawn and deposited from and to crypto exchanges. Usually, increased withdrawals mean Bitcoin investors are buying, while increased deposits mean higher selling activity—both of which affect price.
As of this writing, BTC is testing a key resistance on its 30-day exponential moving average (30-EMA). Bitcoin has been trading below this technical indicator resistance since April while also testing the $60,000 psychological support.
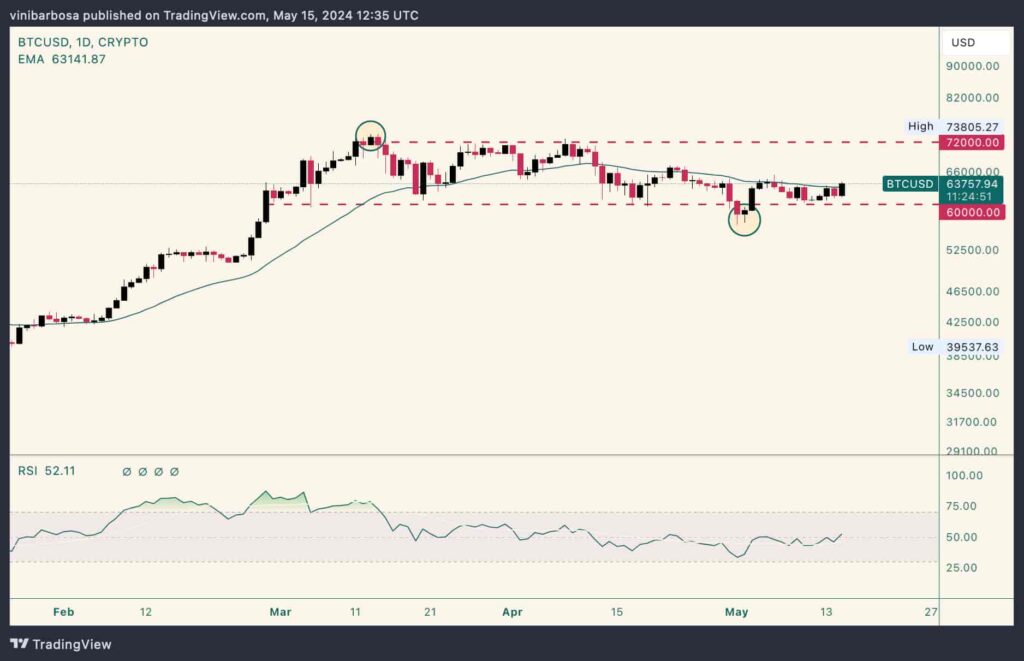
A breakout from any of these prices could set BTC’s next trajectory. Analysts believe Bitcoin has already left a “danger zone” and could be ready for a bounce. However, should the network activity correlation remain, Bitcoin could face a significant drop before visiting higher grounds.
The leading cryptocurrency has kept a price range between $60,000 and $72,000 since February 2024, with two deviations. As cryptocurrencies continue to be a high-volatility market, investors and traders must be cautious while making sensitive financial decisions.
Disclaimer: The content on this site should not be considered investment advice. Investing is speculative. When investing, your capital is at risk.