
With the cryptocurrency market still in a rut and Bitcoin (BTC) struggling to reclaim the $20,000 mark that many have been eyeing for the past several weeks, there could be more bad news in store for the largest crypto.
Specifically, a technical analysis (TA) indicator is displaying a descending triangle pattern similar to the one Bitcoin exhibited during the bear market crash of 2018, as observed by crypto sunmoon, an analyst at the crypto analytics platform CryptoQuant on October 19.
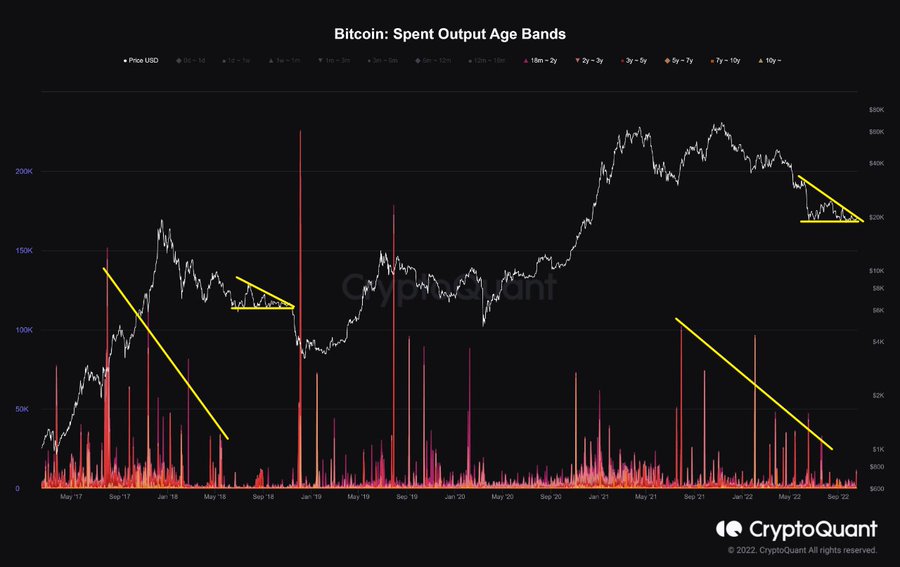
To drive the point home, the analyst posted a chart that shows these similarities, adding that there were a couple of participating factors to take into account when observing such a behavior:
“The movement of long-term hold Bitcoins has decreased, and price volatility is becoming very low.”
Furthermore, should the present descending triangle pattern of Bitcoin’s movements continue, in addition to deviating from the support, the analyst predicts that:
“If the current descending triangle pattern is completed and the price deviates from the support line, there is a possibility of a last crash in the bear market.”
More bleak predictions
Earlier, the 3-day Relative Strength Index (RSI) for Bitcoin showed a pattern of increase which, combined with its price action at the time, indicated a strong selling pressure on the maiden cryptocurrency.
At the same time, crypto trader and analyst Josh Rager identified the so-called ‘bouncing ball pattern’ in conjunction with a rally, for which he voiced his pessimism, stating that “it never ends well,” as Finbold earlier reported.
Not all analysts agree
That said, a TA indicator shared by the pseudonymous crypto analyst Moustache suggests that Bitcoin might be in for a significant push to the upside, adding to his previous predictions that Bitcoin would “soon surprise everyone.”
Moreover, Bitcoin’s market capitalization has dwarfed both that of social media giant Meta Platforms (NASDAQ: META) and the banking giant JPMorgan (NYSE: JPM), which control a market capitalization of $360.58 billion and $349.31 billion, respectively.
As things stand, Bitcoin’s market cap at press time stood at $368.21 billion, as the price of the flagship digital asset amounted to $19,194 with no significant change during the past weeks.
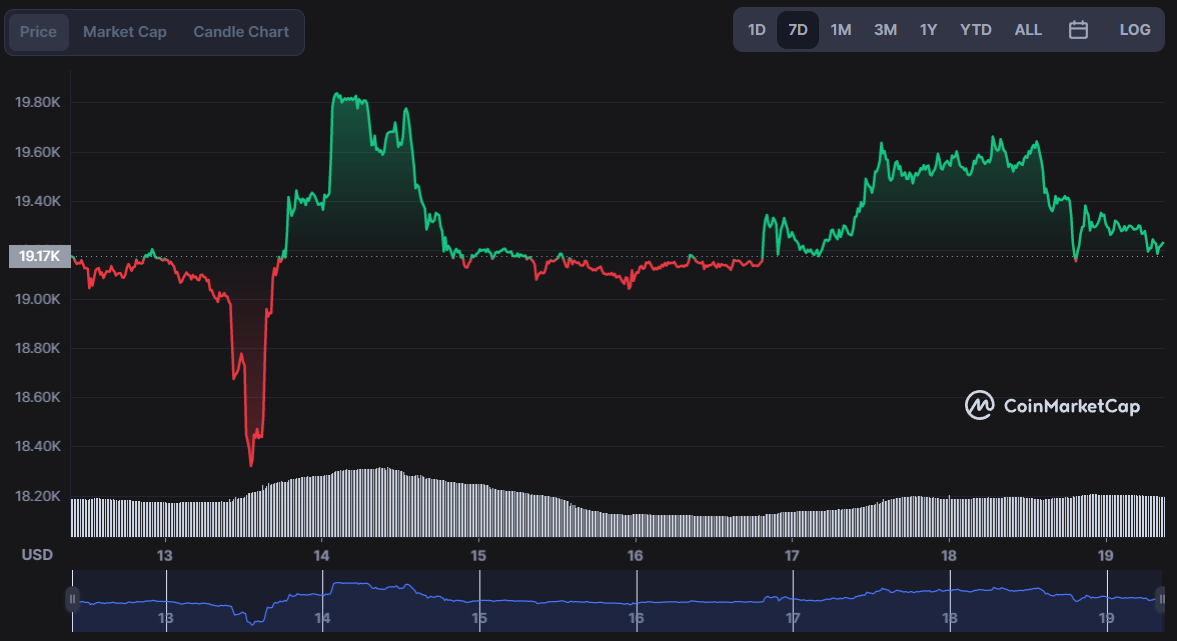
Indeed, its current price represents a decline of 1.98% over the past 24 hours, but is still an increase of 0.29% across the previous seven days, according to CoinMarketCap data retrieved on October 19.
Disclaimer: The content on this site should not be considered investment advice. Investing is speculative. When investing, your capital is at risk.