Solana (SOL) is poised for more aggressive moves once it breaks out from its current consolidation period. On that note, there are key support and resistance levels that Solana investors and traders should watch moving forward.
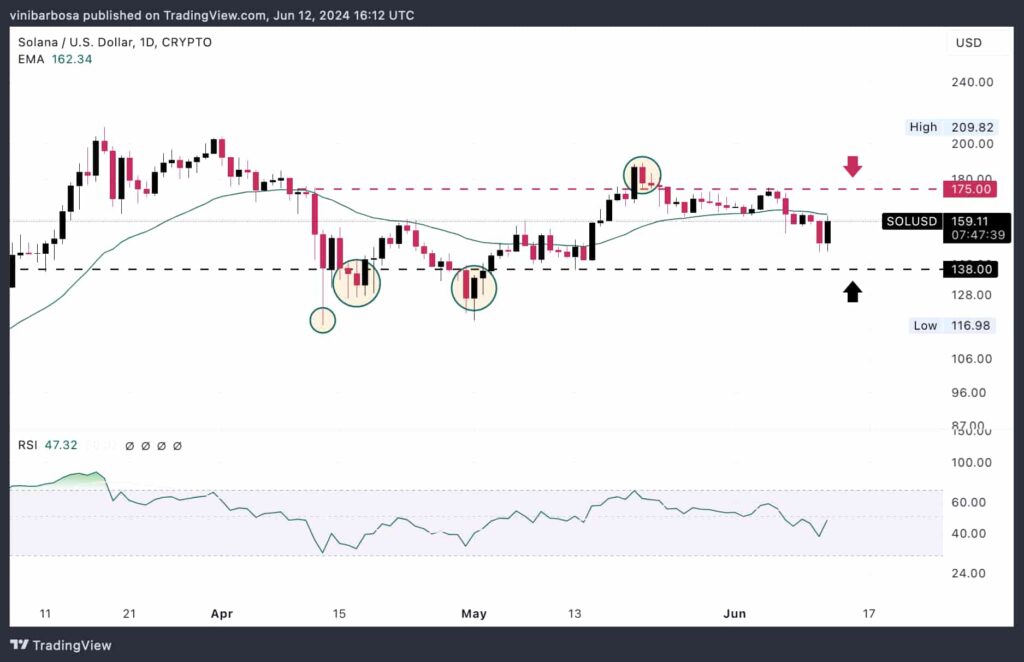
Technical analysis on the SOL/USD daily price chart shows Solana trading at $159 without a clear direction. This is slightly below the 30-day exponential moving average of $162, another key level to watch for both support and resistance insights.
Notably, the most popular Ethereum (ETH) competitor has kept a 2-month price range between $138 and $175. These make key support and resistance levels for Solana, although four deviations occurred—three downwards and one upwards.
Breaking out from this range within a bullish sentiment could cause SOL to revisit this year’s high of nearly $210. Conversely, the first deviation’s lowest price was $117, which makes it a potential target for a bearish bias.
Additionally, the relative strength index (RSI) evidences the neutral momentum for this cryptocurrency‘s native token at 47.3 index points.

Solana’s potential 53% surge if it breaks out from key support and resistance levels
Interestingly, the cryptocurrency trader and analyst Ali Martinez has identified a triangle formation on Solana’s price chart. According to Martinez, the triangle draws key support at $143, in an uptrend line, while having resistance at $178, as a downtrend level that could break out.
In particular, the analyst shows a bullish bias toward a resistance breakout that could drive SOL for a 53% surge. This bias could be benefited from an overall positive sentiment favoring altcoins, as reported by Finbold.
In conclusion, Solana’s key support and resistance levels to watch are $117, $138, $143, $162, $175, $178, and $210. The support levels are more robust than the resistance, suggesting a bullish breakout. It is important, however, to understand that cryptocurrencies are highly volatile digital assets, and indicators are not conclusive.
Disclaimer: The content on this site should not be considered investment advice. Investing is speculative. When investing, your capital is at risk.