
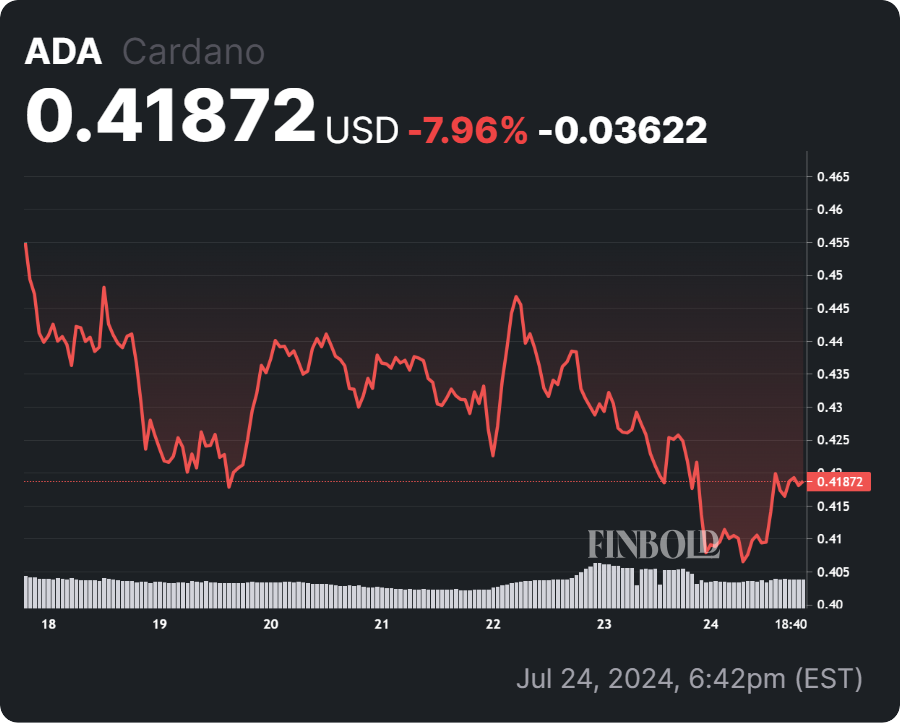
Cardano (ADA), the native cryptocurrency of the Cardano ecosystem, has shown resilience in the recent market recovery. After hitting a low of $0.32 on July 5, ADA rebounded to $0.45 by July 16 and has since been trading steadily around $0.42.
Despite this consolidation, there are emerging signs that ADA might be gearing up for its next bullish phase.
In this context, cryptocurrency analyst Sssebi highlighted that, based on technical indicators and patterns, ADA is poised for a possible rally above the $0.60 mark.
According to his analysis, the immediate resistance level to watch is $0.45, which has been tested multiple times, indicating strong selling pressure.
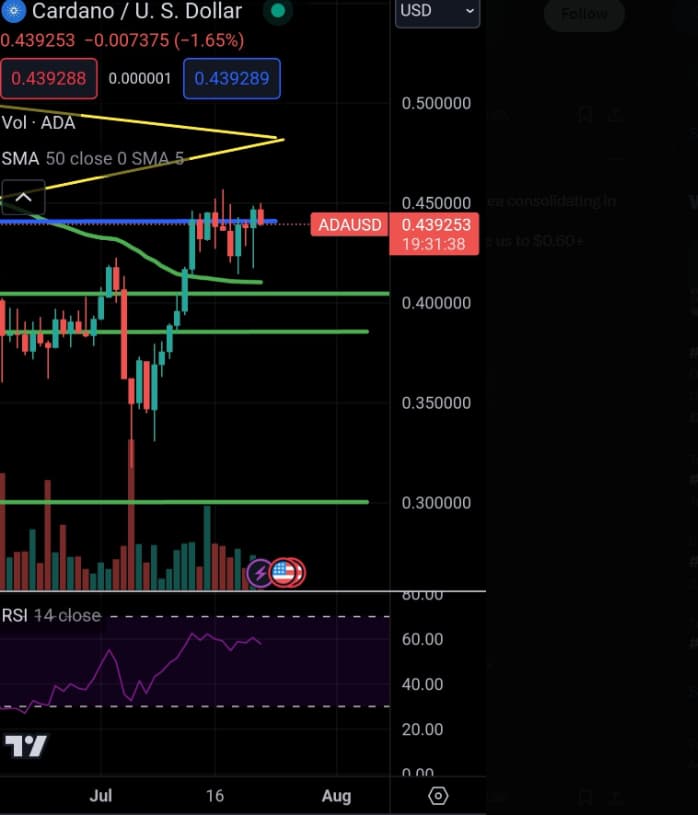
A breakout above this resistance could target around $0.50, a psychological level where further resistance might be encountered. On the downside, the primary support level is at $0.40, which has previously shown strong buying interest and held firm during past corrections.
If ADA breaks below this level, the next critical support to watch is around $0.30. This secondary support level is significant and could halt further declines if the price drops substantially.
Cardano technical indicators and key levels to watch
The Relative Strength Index (RSI) is currently trending above 60 but below 70, indicating that ADA is nearing the overbought territory.
However, it is not yet overbought, suggesting that there might still be room for upward movement before the asset reaches these extreme conditions, making this indicator essential for gauging the momentum of the price action and identifying potential reversal points.
The technical indicators paint a bullish picture for ADA, bouncing between the 50-day moving average and the $0.45 resistance area, consolidating in a pattern similar to a bullish flag.
Therefore, traders should focus on the key resistance level at $0.45 and the primary support level at $0.40. A breakout above $0.45 could target $0.50, while a breakdown below $0.40 might lead to a test of $0.30. Monitoring these levels will be crucial for anticipating ADA’s next move.
Potential targets and ADA price analysis
Given the bullish consolidation pattern, there could be a breakout soon that might hit $0.60 or higher. This potential breakout, especially if accompanied by strong volume, could signal the beginning of a more substantial upward trend.
Conversely, maintaining the support at $0.40 is critical to avoid a downward movement towards $0.30.
Keeping an eye on these support and resistance levels, along with market volume and RSI indicators, will provide better insights into ADA’s potential price movements.
Currently, ADA is trading at approximately $0.41, down by 0.3%. While ADA has shown signs of strength, it remains in a consolidation phase, battling key resistance levels.
Investors and traders should monitor the above key levels and the overall market sentiment closely. A successful breakout could set the stage for significant gains, aligning with the broader bullish trends in the cryptocurrency market.
Disclaimer: The content on this site should not be considered investment advice. Investing is speculative. When investing, your capital is at risk.