
The following guide will examine the ATR indicator, how it is calculated, how to apply it to your trading strategy, as well as the pros and cons of using this technical analysis tool.
Best Crypto Exchange for Intermediate Traders and Investors
-
Invest in cryptocurrencies and 3,000+ other assets including stocks and precious metals.
-
0% commission on stocks - buy in bulk or just a fraction from as little as $10. Other fees apply. For more information, visit etoro.com/trading/fees.
-
Copy top-performing traders in real time, automatically.
-
eToro USA is registered with FINRA for securities trading.
What is ATR in trading?
While longer timeframes will be slower and likely generate fewer trading signals, shorter timeframes will increase trading signals. For example, a shorter average, such as 2 to 10 days, is preferable to measure recent volatility (for day and swing traders). For gauging longer-term volatility, on the other hand, a 20 to 50-day moving average is preferable.
Although it was initially developed for commodity markets, traders now employ the ATR indicator in various financial markets, including trading stocks, cryptocurrencies, or indices.
Key takeaways
– It is usually measured during a two-week period;
– It can be used as part of your entry or exit strategy.
ATR indicator explained
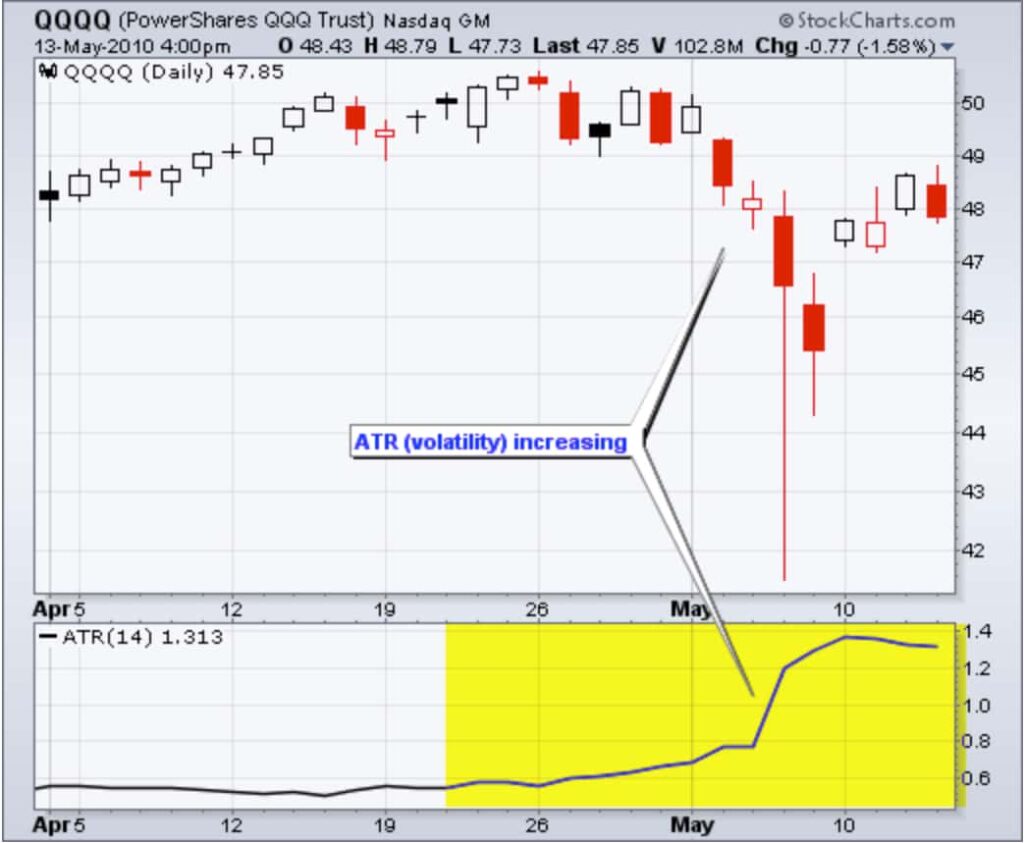
An asset’s range is the difference between the high and low prices during a specified time period. It reveals information about the asset’s volatility, with large ranges indicating high volatility and small ranges indicating low volatility.
The ATR indicator fluctuates as the price moves in the security become larger or smaller. Therefore, a new ATR reading is calculated as each period passes. For example, a new ATR reading is calculated every minute on a one-minute chart. On a daily chart, on the other hand, a new ATR is calculated every day. The readings are then plotted on a graph to form a continuous line, giving traders an idea of how volatility has fluctuated over time.
To determine the ATR for today, you must first calculate a series of true ranges. The true range value is derived by taking the greatest of the following:
- Today’s high minus today’s low;
- The absolute value of today’s high minus yesterday’s close;
- The absolute value of today’s low minus yesterday’s close.
Recommended video: Average True Range Indicator Explained Simply In 3 Minutes
Investing for beginners:
- What is Investing? Putting Money to Work
- 17 Common Investing Mistakes to Avoid
- 15 Top-Rated Investment Books of All Time
- How to Buy Stocks? Complete Beginner’s Guide
- 10 Best Stock Trading Books for Beginners
- 15 Highest-Rated Crypto Books for Beginners
- 6 Basic Rules of Investing
- Dividend Investing for Beginners
- Top 6 Real Estate Investing Books for Beginners
Best Crypto Exchange for Intermediate Traders and Investors
-
Invest in cryptocurrencies and 3,000+ other assets including stocks and precious metals.
-
0% commission on stocks - buy in bulk or just a fraction from as little as $10. Other fees apply. For more information, visit etoro.com/trading/fees.
-
Copy top-performing traders in real time, automatically.
-
eToro USA is registered with FINRA for securities trading.
ATR formula
The formula to calculate ATR (with a previous ATR calculation) is:
ATR = (Previous ATR * (n – 1) + TR) / n
Where:
ATR: average true range;
n: number of periods;
TR: true range.
If the previous ATR is not calculated, you must use the following arithmetic mean (the sum of all observations divided by the number of observations) formula:
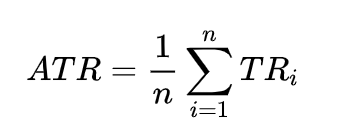
Where:
TRi: particular true range, like first day’s TR, then second, then third;
n: number of periods.
ATR indicator calculation example
Typically, 14 periods are used, and therefore the calculation is expressed as:
Current ATR = ((Previous ATR x 13) + Current TR) / 14
Let’s assume the previous 14-day ATR for stock X is $2. Looking at stock X today, you collect the following data:
- Today’s high: $42
- Today’s low: $39
- Yesterday’s close: $40
We find the current true range by taking the greatest value from these three calculations:
- $42 – $40 = $2
- $39 – $40 = -$1
- $42 – $39 = $3
The true range is $3 because it’s the highest. We can now use this to determine the current 14-day period ATR to assess stock X’s volatility by using the following formula:
(($2 x 13) + $3) / 14 = $2.07
Now, let’s imagine that stock X is up $3 on the day, i.e., the trading range (high minus low) is $3. Therefore, the price has increased 47% from the average true range of $2.07, signaling the trader to take a long position. However, though the buy signal may be valid, since the price has already moved substantially more than average, betting on the price’s continued rise may not be wise (unless there is a news event that indicates the price might rally further).
Instead, because it has moved significantly more than the average, it is more likely to fall and stay within the established price range. Assuming a valid sell signal is triggered, traders might take a short position in this case.
Summing it up
So, while the ATR can’t tell us the direction of the breakout, we can add it to the closing price and use it as a buy signal whenever the price is trading above that value the next day. To sum up, a change in volatility occurs whenever the price closes more than an ATR value above the most recent close.
How to use the ATR indicator in trading
Although Wilder originally developed the ATR for commodities, the ATR indicator can also be used for various other financial instruments, including stocks, cryptocurrencies, or indices. In short, an asset experiencing a high level of volatility has a higher ATR. Conversely, lower volatility is characterized by lower ATR values for the period evaluated.
The ATR is a valuable technical tool for finding entry and exit points, particularly because it’s relatively straightforward to calculate and only requires historical price data. Importantly, the indicator cannot indicate price direction.
Instead, it is used mainly to gauge volatility caused by gaps (a discontinuous space in the price of an asset, often occurring between trading hours) and limit moves (the maximum amount of change a commodity futures contract’s price is authorized to undergo in a day, set by an exchange).
ATR indicator in entry and exit strategies
To conclude, the ATR indicator can be used as part of your entry or exit strategy:
- Entry: Short-term traders commonly use ATR breakout systems to time entries. For long positions, adding the ATR (or a multiple of the ATR) to the next day’s open price and entering the trade when prices exceed that level. For short positions, on the other hand, the ATR (or a multiple of the ATR) is subtracted from the open price, and a trade is entered once that level is broken. In addition, the ATR breakout system can serve as a longer-term approach by entering at the open after a day that closes above the close plus the ATR value or below the close minus the ATR.
- Exit: The ATR is commonly used as an exit method that can be applied regardless of the type of entry used. For example, one popular technique is referred to as the “chandelier exit.” It is designed to keep traders in a trend and prevent an early exit as long as the trend prevails. In short, traders use the “chandelier exit” as a trailing stop-loss and as a hedge against losses resulting from trend reversals.
ATR trailing stop indicator
As mentioned above, the ATR indicator can be used to form an exit strategy by placing trailing stop-losses. A rule of thumb is multiplying the current ATR by two to determine a prudent stop-loss point. So, if you’re going long, you might place a stop-loss at a level twice the ATR lower than the entry price. If you’re going short, you might place a stop-loss at a level twice the ATR above the entry price.
If you’re going long and the price moves favorably, you can continue to move the stop-loss to twice the ATR below the price. In this case, the stop-loss only moves up, not down. After it has moved up, it remains there until it can be moved up again. Alternatively, the trade is closed if the price falls and hits the trailing stop-loss level. This also applies to short trades. In that case, however, the stop-loss only moves down.
Example
Pros and cons of the ATR indicator
Like most other technical analysis tools, the ATR indicator also comes with its own distinct advantages and disadvantages. To effectively implement this technical indicator in your trading strategy, it’s essential to understand where it triumphs and where it can fall short.

Pros
- Reflects price volatility: The ATR indicator is an excellent tool for identifying market transitions from high to low periods of volatility;
- Can reveal entry and exit locations: The indicator can help traders confirm entry points as well as determine the placement of a stop-loss;
- Can be applied to various financial instruments: Traders can use the ATR indicator on different asset classes, including cryptocurrencies, commodities, and stocks;
- Versatile: Useful as a standalone tool or in conjunction with other technical indicators.

Cons
- Subjective nature: No single ATR value can tell you with total certainty that a trend is about to reverse. Instead, traders should compare ATR readings against previous readings to better gauge the trend’s strength or weakness;
- Doesn’t measure the direction of price: The ATR only measures volatility but not the direction of a security’s price, which can sometimes result in mixed signals, especially when markets are experiencing pivots or when trends are at turning points. For example, a sudden growth in the ATR following a substantial move against the prevalent trend may lead traders to believe the ATR is confirming the old trend; yet, this may not be the case;
- Limited: As with all indicators, the ATR should only be used as part of a complete trading plan, not in isolation.
In conclusion
The ATR is a unique volatility indicator that reflects the degree of enthusiasm/commitment or disinterest in a move. Large or increasing ranges typically demonstrate traders are ready to continue to bid up or sell short a stock throughout the day. Conversely, decreasing or narrow ranges suggest waning interest.
As such, the ATR is a valuable tool for providing traders with entry and exit points. While calculating an investment’s ATR is relatively simple, employing this indicator alongside other technical analysis devices is highly recommended. As with any technical indicator, the more confirming factors are present, the more reliable a trade signal is likely to be.
Disclaimer: The content on this site should not be considered investment advice. Investing is speculative. When investing, your capital is at risk.
FAQs about the ATR indicator
What is the ATR indicator?
The ATR, or average true range indicator, is a technical analysis tool that measures market volatility. It also shows how much a security’s price moves, on average, over a specified period.
What does the ATR indicator tell you?
As a volatility indicator, the ATR gives traders a sense of how an asset’s price could move. Used in tandem with other technical indicators and strategies, it helps traders spot entry and exit locations.
What period is used for the ATR indicator?
The standard ATR calculation is based on 14 days. However, traders can use shorter or longer timeframes based on their trading preferences. For example, if you need to measure recent levels of volatility, use a lower number, which indicates a shorter period. Long-term investors, on the other hand, may prefer a larger number to take a more comprehensive measurement.
What is a good average true range?
How good the ATR is varies depending on the specific asset in question. However, if an asset typically maintains an ATR close to $1.18, we usually say it is performing normally.
How to use ATR trailing stop indicator?
To use the ATR trailing stop indicator, first calculate the ATR value for a specified period. Then, set the trailing stop a certain number of ATRs away from the current price. As the price moves favorably, adjust the stop-loss level accordingly, maintaining the set ATR distance. This method helps manage risk by allowing for price fluctuations while protecting profits.
How to use ATR indicator for stop loss?
To use the ATR indicator for setting a stop loss, first determine the ATR value over a chosen period (e.g., 14 days). Then, set your stop loss at a multiple of the ATR below the current or entry price for long positions, or above for short positions. This distance allows for market volatility while protecting against significant losses.
Best Crypto Exchange for Intermediate Traders and Investors
-
Invest in cryptocurrencies and 3,000+ other assets including stocks and precious metals.
-
0% commission on stocks - buy in bulk or just a fraction from as little as $10. Other fees apply. For more information, visit etoro.com/trading/fees.
-
Copy top-performing traders in real time, automatically.
-
eToro USA is registered with FINRA for securities trading.