The following guide will examine pivot points, how they’re calculated, how to apply them to your trading strategy, as well as the pros and cons of using this technical analysis tool.
Best Crypto Exchange for Intermediate Traders and Investors
-
Invest in cryptocurrencies and 3,000+ other assets including stocks and precious metals.
-
0% commission on stocks - buy in bulk or just a fraction from as little as $10. Other fees apply. For more information, visit etoro.com/trading/fees.
-
Copy top-performing traders in real time, automatically.
-
eToro USA is registered with FINRA for securities trading.
What are pivot points?
If the market trades above the pivot point in the ensuing period, it is generally viewed as a bullish inclination. Conversely, trading beneath the pivot point is typically seen as bearish.
Traders employ pivot points and the support and resistance levels they establish to identify possible entry and exit points, both for stop-losses and profit-taking.
Pivot points can be calculated across different time frames to provide insights for day traders, swing traders, and long-term investors alike and can be used across a wide array of asset classes, including forex exchange, stocks, commodities, cryptocurrencies, futures, options, and index funds.
Investing for beginners:
- What is Investing? Putting Money to Work
- 17 Common Investing Mistakes to Avoid
- 15 Top-Rated Investment Books of All Time
- How to Buy Stocks? Complete Beginner’s Guide
- 10 Best Stock Trading Books for Beginners
- 15 Highest-Rated Crypto Books for Beginners
- 6 Basic Rules of Investing
- Dividend Investing for Beginners
- Top 6 Real Estate Investing Books for Beginners
Types of pivot points
There are five primary types of pivot points:
- The standard pivot point: The standard pivot utilizes a five-point system based on the previous day’s high, low, and closing prices, along with two support levels and two resistance levels (adding up to five price points);
- Woodie pivot points: The calculation is similar to the standard pivot formula. However, Woodie’s pivot points place more weight on the closing price.
- Camarilla pivot points: It’s similar to Woodie’s pivot point. However, there are four resistance levels and four support levels;
- Fibonacci pivot points: The calculation is similar to the standard pivot point formula. However, Fibonacci pivot points also incorporate Fibonacci retracement levels;
- Demark pivot points: Demark pivot points begin with a different base and use a distinct formula for support and resistance. These pivot points are subject to the relationship between the opening and closing prices.
This guide will delve into the most popular and widely used pivot point: the standard pivot point.
Recommended video: Introduction to pivot points
Pivot point calculation
While there are other ways of calculating pivot points, the standard method uses a five-point system in which the previous day’s high, low, and close prices, along with two support and two resistance levels, derive a pivot point.
Pivot point (P) = (Previous High + Previous Low + Previous Close)/3
S1= (P x 2) – Previous high
S2 = P – (Previous High – Previous Low)
R1 = (P x 2) – Previous Low
R2 = P + (Previous High – Previous Low)
Where:
S1= Support 1
S2 = Support 2
R1 = Resistance 1
R2 = Resistance 2
Typically, pivot points are determined with data collected from the previous day to guide trading decisions on the following day. However, it’s also possible to use last week’s data and make pivot points for the following week (particularly helpful for swing traders).
Pivot points example calculation
If you are looking to start trading on Thursday morning, use Wednesday’s high, low and close points to set your pivot point levels. Go ahead and follow these steps:
- Once the market has closed for the day (on Wednesday) or before it opens again (on Thursday), take note of the highest and lowest daily prices as well as the day’s closing price;
- Calculate the average of the high, low, and close values by adding them together and then dividing by three;
- Mark this value on the chart as P;
- After P is determined, calculate S1, S2, R1, and R2 using the highs and lows from Wednesday’s trading session.
Best Crypto Exchange for Intermediate Traders and Investors
-
Invest in cryptocurrencies and 3,000+ other assets including stocks and precious metals.
-
0% commission on stocks - buy in bulk or just a fraction from as little as $10. Other fees apply. For more information, visit etoro.com/trading/fees.
-
Copy top-performing traders in real time, automatically.
-
eToro USA is registered with FINRA for securities trading.
How to use pivot points?
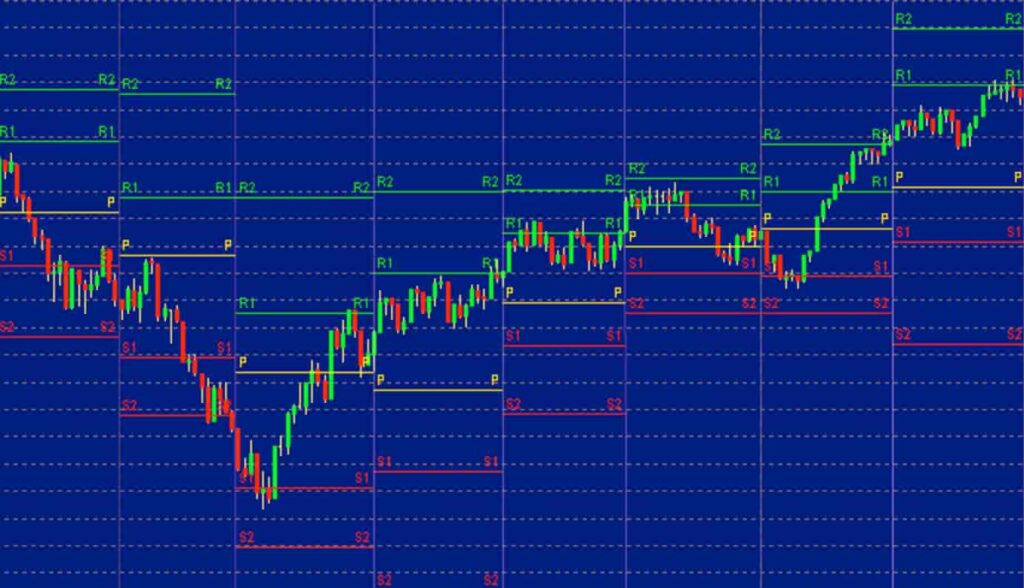
Unlike moving averages or oscillators, pivot points are static and remain at the same prices throughout the day. This means traders can use the levels to help plan out their trading in advance. Pivot points are best used when the market is trending rather than in range-bound (prices staying in a definable range over time) or consolidating markets.
Traders can use pivot points in two ways:
To determine market trends
Traders can utilize pivot points to determine the overall market trend. The market is bullish if the pivot point price is broken in an upward movement. Alternatively, it is bearish if the price drops below the pivot point.
To find entry and exit points
By plotting pivot points, traders can decide when to open and close their positions in the market. For instance, a trader may enter a limit order to purchase 100 shares when the price surpasses a predetermined resistance level. Conversely, an investor may place a stop loss level close to or at the support level.
Trading with pivot points
There are two primary trading strategies used with pivot points:
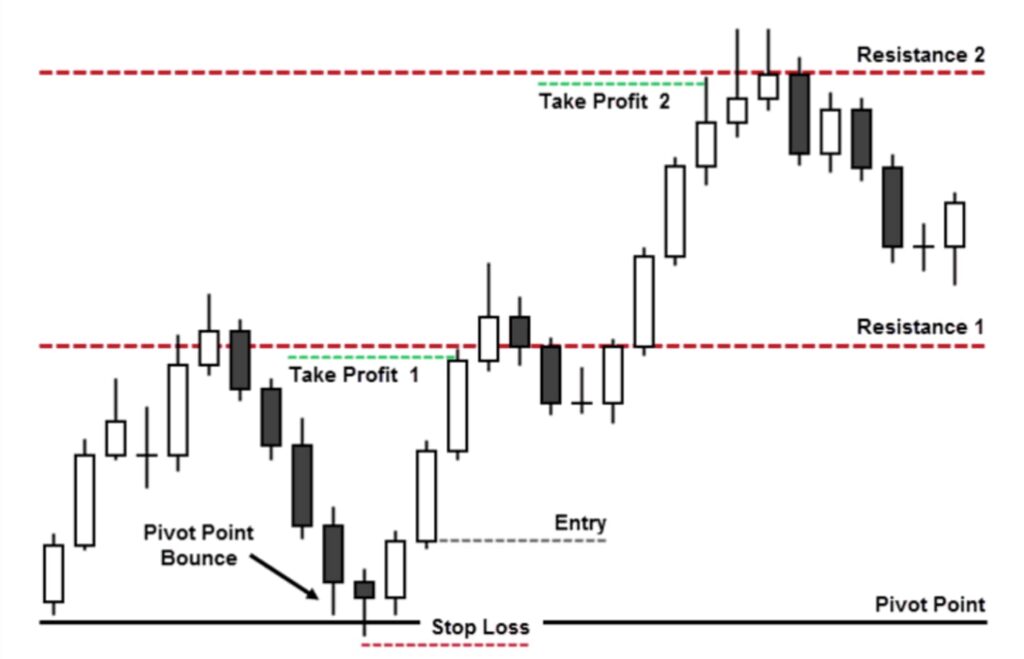
Pivot point bounce trading
If the price action stalls and bounces back before reaching the pivot level, you can capitalize on this movement by entering a trade per the direction of the bounce. When the security is testing a pivot line from the upper side and bounces upwards – that is your cue to enter a long (buy) trade. Conversely, if the price is testing a pivot line from the lower side and bounces downwards, you ought to short the security.
If you are opening a short trade, your stop-loss should be placed above the pivot line. On the other hand, if you are going long on a trade, your stop-loss should be located below the pivot line.
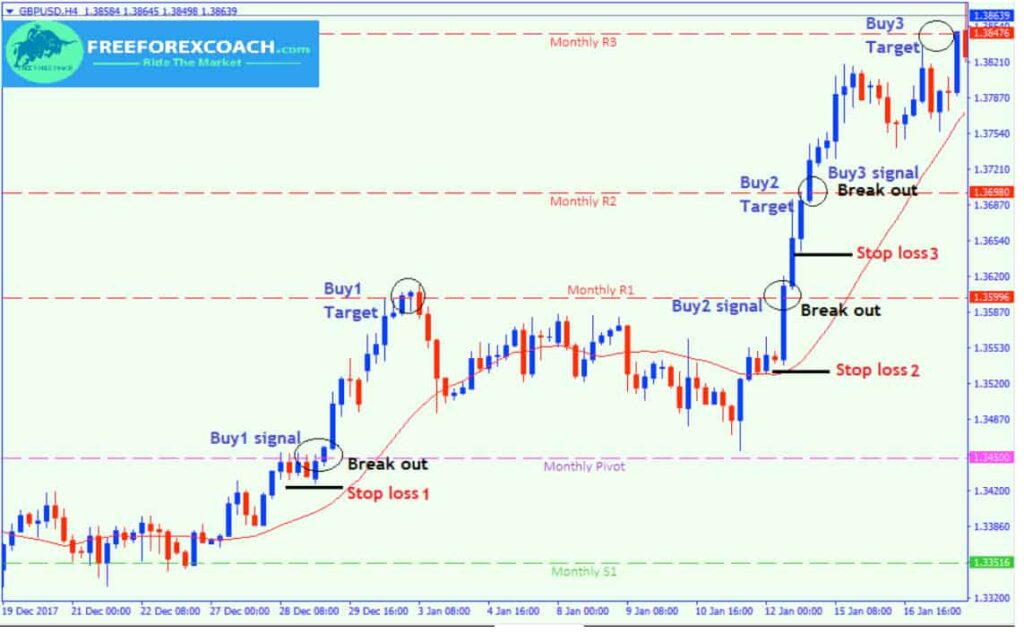
Pivot point breakout trading
To execute a pivot point breakout trade, open an order with a stop limit once the price breaks through a pivot level. These breakouts are most likely to occur in the morning’s early hours. Traders should establish a short position in a bearish breakout and go long in the event of a bullish breakout.
When trading pivot point breakouts, always use a stop loss. Strategically, a stop-loss order should be placed just on the other side of the pivot line to maximize profits. For instance, the sell-stop would be placed slightly under the pivot line on long positions.
It is wise to maintain the position until price action reaches the next pivot level to guarantee the most significant potential return on your pivot point breakout trade.
Pros and cons of pivot points
Like most other technical analysis tools, pivot points also come with their own distinct advantages and disadvantages. To fully harness this technical indicator in your trading strategy, it’s essential to understand where it triumphs and where it can fall short.

Pros
- Helpful at determining trend direction: Using the prior day’s trading action, pivot points can provide traders with an overview of what to expect in today’s market;
- Incorporated into trading software: A pivot point indicator is an easy-to-use tool integrated into most trading platforms that automatically calculate support and resistance levels, so the trader doesn’t have to;
- Leading indicator: Unlike lagging or coincident indicators, leading indicators can anticipate future price movement;
- Versatile: Useful as a standalone tool or in conjunction with other technical indicators.

Cons
- No guarantees: There is no guarantee that the price will stop at, reverse or reach the levels indicated on a chart. Furthermore, sometimes, the price may keep fluctuating up and down through a level;
- Limited for trending markets: Pivot points can only give the most accurate signals in trending markets;
- Limited: As with all indicators, pivot points should only be utilized as a part of a complete trading plan and should not be employed in isolation.
In conclusion
Pivot points offer traders a methodology to determine price direction and set support and resistance levels. Given how easy they are to calculate, pivot points can be incorporated into many trading strategies, making them a valuable addition to anyone’s trading arsenal.
However, despite being highly accurate in forecasting price movement, occasionally, the levels have little or no influence. So, as with all indicators, it is crucial to confirm pivot point signals with other aspects of technical analysis. Remember, the more confirming factors are present, the more robust and reliable a trade signal is likely to be.
Disclaimer: The content on this site should not be considered investment advice. Investing is speculative. When investing, your capital is at risk.
FAQS about pivot points
What are pivot points?
Pivot points are calculated price levels utilized in financial markets to indicate market direction.
How to calculate pivot points?
Pivot points are calculated through a five-point system, in which the previous day’s high, low, and close prices, along with two support and two resistance levels, derive a pivot point.
Who are pivot points for?
Pivot points are most widely used by day traders though they can also offer valuable insight for swing traders and long-term investors.
What do pivot points tell you?
Pivot points can point to potential entry and exit points as well as forecast market trends. For example, if the price falls below the pivot point, traders are likely to short early in the session. Conversely, if the price is above the pivot point, they will be buying.
How to trade pivot points?
To trade with pivot points, calculate them using the previous day’s high, low, and close prices. These points indicate potential support and resistance levels. Buy when the price rises above a pivot level and sell when it falls below. Using pivot points effectively involves integrating them with other market indicators and trends, especially in day trading for short-term predictions.
Best Crypto Exchange for Intermediate Traders and Investors
-
Invest in cryptocurrencies and 3,000+ other assets including stocks and precious metals.
-
0% commission on stocks - buy in bulk or just a fraction from as little as $10. Other fees apply. For more information, visit etoro.com/trading/fees.
-
Copy top-performing traders in real time, automatically.
-
eToro USA is registered with FINRA for securities trading.