
Fundamental analysis is one of the two main methods, along with technical analysis (TA), that can help find good investment opportunities, used by investors as a tool for strategies like value investing or growth investing. This guide will explain what fundamental analysis is, how it works, give examples, compare it to technical analysis, as well as highlight differences between qualitative and quantitative fundamental factors.
What is fundamental analysis?
Fundamental analysis definition
The thought process behind FA is that sometimes market prices aren’t considering all fundamental factors and become over or undervalued. Investors consider various economic and financial factors such as the overall state of the economy, competition, or financial reports of each asset or a security – anything that impacts a specific economy.
Figuring out what could affect the price of company stock or a specific commodity is like research; you have to find all available data and draw conclusions about which factors could affect its supply and demand.
How to do fundamental analysis?
Depending on the approach, to do fundamental analysis, investors either assess the strength of the overall economy first before concentrating on the individual performance of a stock, or vice versa, starting with analyzing a particular company’s financial performance.
Fundamental analysis is one of the two main methods used to determine new investment opportunities, along with technical analysis (TA), which assumes that market prices already reflect all fundamental factors and are entirely accurate, instead of looking at historical price and volume data to forecast future prices.
The overall goal of fundamental analysis is to find and determine whether the asset is under or overvalued and to calculate its fair or intrinsic value.
What is fair market value, and how is it determined?
Fundamental analysis is often used to determine if a company stock might be trading at a lower or higher price than its true or intrinsic value, which is why we will use it as an example in most cases going forward.
It should also be noted that intrinsic value is calculated differently for other assets, such as options trading, which uses a standard calculation, and fundamental analysis can come to an intrinsic value of a stock, bond, or currency.
- Market value or market price is the current listed price of an asset at which price it can be bought or sold, determined by supply and demand levels.
- Fair market value or intrinsic value is the price when specific conditions are met, for example, considering company fundamental factors. The asset could be sold and bought for at this price – a hypothetical value considering all available information.
Ultimately, whether a stock is undervalued is an assumption and comes down to the investor’s viewpoint, depending on how each individual translates the information.
An analyst creates a basis of the most relevant information to determine the estimated fair value of a company’s share price based on all relevant fundamental factors. The end value is an estimate, an educated opinion, that an investor or analyst thinks it is worth.
Fundamental analysis example
A stock is trading in the market for $10 per share, and an analyst has published results and determined it should be worth $16 after considering all fundamental factors.
However, another analyst suggests it should be worth $14, also significantly above the market price. Investors can base their decision on the recommendations, seeing the likely stock trading below these intrinsic values.
Fundamental analysis of stocks vs. forex fundamentals
Fundamental analysis is widely used for stock analysis but can also be applied to other markets, such as forex or futures; however, the approach to the study would be slightly different. Investors assessing stocks typically take a bottom-up approach, doing in-depth research of their financials, such as annual or quarterly reports.
For the forex market, however, investors would initially focus on a top-down approach to understand the impact of economic, political, and social factors on evaluating the relative currency value. For the futures market, the analysis initially focuses more on the economic factors that could influence supply and demand.
For example, if the unemployment rate is increasing in a specific country, it can eventually negatively affect the demand for its currency and weaken it.
Key parts of fundamental analysis
Fundamental analysis or Economic Industry Company (EIC) analysis includes an analysis of the entire economy, then defines industries, after which identifying individual companies to get a full picture of whether the asset might be listed at an undervalued price.
It is a very comprehensive approach to investing that requires a lot of research, which is why a good understanding of the economy, accounting, and finance is often necessary.
Key parts of fundamental analysis are:
Economic factors
This stage is about looking at the overall state of the economy, including both microeconomic and macroeconomic factors, to determine future supply and demand levels.
While a top-down approach looks at the macroeconomic factors and overall performance of economies of countries and governments, a bottom-up approach with a focus on microeconomic factors is more commonly used by investors to study specific individual businesses.
Macroeconomics includes Gross Domestic Product (GDP), inflation, exchange rates, wages, consumer spending, interest rates, and any variables influenced by the economy, which are usually the highest-level indicators affecting the financial health of an economy. Microeconomics includes supply and demand, taxes, and regulations.
For investors conducting fundamental analysis, the most relevant economic factors affecting businesses are interest rates, tax rates, exchange rates, inflation, unemployment rates, wages, supply and demand, recessions, and government activity.
For example, suppose the economy is strong, and the GDP is growing. In that case, it can also increase the demand for cars, and as a result, the need for commodities like steel and aluminum often used in car production, increasing the prices for these commodities.
Investors might also look at stocks of car companies as a good investment during the growth phase, as when the economy is strong, they expect car demand to go up. Or vice versa, a drop in consumer spending during recessions could reduce production due to lower purchasing power.
Industry analysis
The industry is a specific group of companies that share the same or similar business goals and operate in the same segment of the economy, often interchangeably with sectors, which is a broader segment than the industry.
Industry analysis assesses the financial and economic conditions currently affecting that specific industry to offer insight into which companies are expected to perform and find profitable investments.
For example, during an economic downturn at the onset of the Covid-19 pandemic in 2020, the consumer staples industry benefited, and the luxury goods declined. Industries could be clustered into non-cyclical (consumer staples), high-risk (financial institutions), low-risk (healthcare), or cyclical (airlines).
In an economic expansion, interest rates are low, and the economic growth is starting to pick up, investors would invest in businesses that benefit from these conditions. Vice versa, during a recession, the focus would shift to low-risk or non-cyclical stocks.
Company analysis
Fundamental analysis is usually based on publicly available financial data, such as a company’s revenue and margins, which investors can find in annual and quarterly financial reports published by publicly listed companies on their corporate pages.
Company analysis requires reading and interpreting these results and understanding fundamental financial metrics and how they might affect the company’s future growth.
It considers financial metrics like earnings per share (EPS), the price-to-earnings ratio (P/E), price-to-earnings growth (PEG), or dividend yield, but also its competition, management, and business model.
Therefore, investors can base their investment decisions on their assumptions about what they think is the “right” price – the intrinsic value of the company stock. As a result, an asset or security can either be overvalued, undervalued, or accurately priced.
Key assumptions of fundamental analysis
Key assumptions of fundamental analysis:
- Market price doesn’t fully reflect all currently available data;
- Price only when considering the company’s fundamental data is more likely to be the fair value;
- The market price will eventually adjust and reflect its fair market value; however, this could take some time, and no one knows how long precisely, which enables higher profitability.
Once the market catches up with all the fundamentals discovered by investors, that is when the investments start to pay off; however, this is no guarantee, as it might not happen if the investor was wrong about their assumption.
Fundamental analysis vs technical analysis: Which is better?
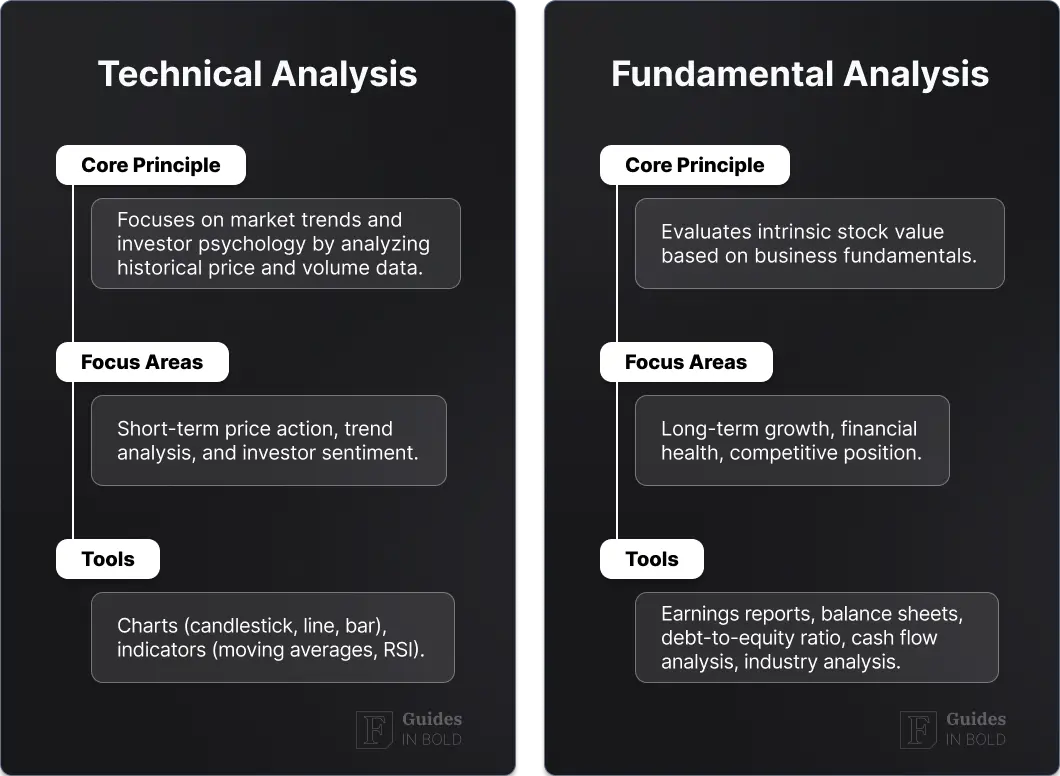
Fundamental analysis can help define if an asset is trading under or over its market value, whereas technical analysis assumes the market price is already correct. Instead, technical analysis attempts to forecast future price movements by analyzing charts, patterns, and indicators from historical price and volume.
Moreover, technical analysis takes a short-term approach, useful for trading as it looks at data in hours, days, weeks, or months; fundamentals are more beneficial for long-term investments, looking at data and information over quarters or years.
Investors using fundamental analysis often have to wait years to see their investments pay off and generate profits, only once market prices reflect their fair value. So, for example, a change from a new product launch might not be immediate, and success could take years to affect the share price positively.
Qualitative vs quantitative fundamental analysis
Various fundamental factors are divided into two categories based on the data analyzed: qualitative and quantitative.
- Quantitative factors, such as financial performance metrics like revenue and profits, can be measured. In contrast, qualitative factors could be related to the product, business model, or company management.
- Qualitative factors are non-numerical and intangible, which can be translated differently by each individual investor, such as new product launches, technology, or management that can affect a company’s future performance and growth.
When performing the analysis, it is essential to consider both – quantitative can show a company’s current overall financial health and profitability, and qualitative factors can indicate its long-term potential.
For example, suppose a business is profitable but has a pending litigation case. In that case, it can potentially harm the company’s reputation, which is why both should be accounted for in fundamental analysis to get a complete picture.
1. Quantitative fundamental analysis
The quantitative side of fundamental analysis involves an in-depth analysis of financial statements, in which a company discloses information concerning its financial performance. Public companies usually release these reports annually or quarterly.
Understanding critical metrics in these reports is essential for determining the financial strength of a business, as investors using fundamental analysis use this information to make investment decisions.
The essential metrics to learn and conclude in the financial reports are:
- Assets and liabilities;
- Cash flow;
- Revenue;
- Price-to-earnings ratio;
- Price-to-earnings-growth;
- Dividend yield.
And the three most important financial statements to find these metrics are income statements, balance sheets, and cash flow statements:
- Balance Sheet
The balance sheet records all company’s assets, liabilities, and equity (total financing value the company has used to acquire assets).
- Assets = Liabilities + Shareholders’ Equity
- Assets – resources a company owns or controls at a given time, including cash, inventory, machinery, or real estate.
- Liabilities – everything a company owes, such as bank debt, mortgage debt, accounts payable, or taxes.
- Equity = total value of money owners have contributed to the company, including profits made in previous years.
Balance sheets can show investors how efficiently a company manages its receivables and inventory, the amount of revenue generated from its assets, and ultimately, how they use its assets to generate profits.
- The Income Statement
Income statement, also known as a profit and loss statement, shows revenues and expenses, gains and losses during a particular period of a company:
Net Income = (Total Revenue + Profits) – (Total Expenses + Losses)
Whereas the balance sheet shows the overall performance as of a particular date, the income statement is where a business’s performance is measured as a result of its operations over a specific period, e.g., quarterly or annual results. Investors can therefore see how much the company earned or how much it lost to analyze the current financial health of the company.
- Cash Flow Statement
Cash flow refers to the total net amount of cash transferred in and out of a company, with inflow representing money coming in and outflows money spent over a set period of time, cash flow statement reports on the usage of cash of a business.
If generally outlines cash flows of the following business activities:
- Cash from investing (CFI): cash used for investing in assets or equipment for the company, long-term assets, or from the sale of other businesses;.
- Cash from financing (CFF): cash from issuing and borrowing funds between a company, its owners, investors, and creditors;
- Operating Cash Flow (OCF): cash generated from business operations.
A cash flow statement is an integral part of the fundamental quantitative analysis to measure a company’s financial health because if earnings can be more easily faked, it isn’t as simple to manipulate money coming in and out of the bank accounts.
Even though the quantitative part of the fundamental analysis is crucial, it has some limitations, as it doesn’t consider more intangible and unmeasurable factors. For example, legal issues, new product innovations, or changes in top-level management could all significantly affect the stock’s price, which is why combining the analysis with fundamental qualitative factors is necessary.
2. Qualitative fundamental analysis
The main qualitative aspects that fundamental analysts generally consider include the business model of a company, its competitive advantage, management team, and corporate governance, which are helpful for a deeper understanding of a company’s potential.
Moreover, it is also important to consider the industry aspects a company is operating in: competitors, audience or customer base, size of the market share, growth compared to industry peers, regulations, and business cycles.
Other qualitative aspect examples include pending legal cases, customer satisfaction with a company’s products, relationships with key suppliers, or ownership of an innovative new technology or a product, which can either negatively or positively affect a company’s reputation and future success.
Even though determining the extent of qualitative fundamental factors’ effect on the company’s performance can be challenging compared to numerical factors, as they can be more subjective to individual interpretation, qualitative factors are still an essential part of the analysis.
Four key qualitative fundamentals to consider when assessing a company:
- Business model:
Analyzing its business model can reveal how the company operates and how it makes money. For example, a newspaper isn’t perhaps making money from subscription fees but instead generates most of its revenues through advertising.
It is also important to pay attention to what they sell and at what prices compared to competitors – are they competitive, or whether they are too expensive considering the product quality and the brand?
- Competitive advantage:
Competitive advantage is a unique selling point of a company that enables them to stand out from its industry peers, for example, offer more premium or affordable products or services.
These factors can include higher product quality, better supplier network, intellectual property, branding, customer service, or technological improvements – unique advantages that might allow a business to operate better or more productively than its market rivals.
For example, Coca-Cola (NYSE: KO) and Apple (NASDAQ: AAPL) have a competitive advantage over smaller brands due to their established and well-known brand recognition. Or take Amazon (NASDAQ: AMZN), for instance, which has achieved significant success due to its broad product offerings and fast delivery times.
A company’s long-term success often depends on its ability to establish and maintain its competitive advantage, allowing them to get ahead of the competitors and grow revenues and profits, which would, in turn, also reward shareholders in the long term.
- Executive management:
The senior leadership of a company is another essential qualitative fundamental factor. After all, even the most well-planned strategies can fail if management isn’t qualified to execute them. Therefore, a company needs top-quality people in the lead to implement a business plan or maintain a company’s competitive edge.
Information about the leadership team is usually publicly available online on corporate websites, or social media resumes. Some key things to look out for in the management team are their capabilities, strengths and weaknesses, previous experience, or even if they’ve recently sold their stocks to ensure the company can deliver on its promises.
- Corporate Governance:
Corporate governance is a set of practices and processes – a regulatory framework for monitoring companies for relevant interest groups – its stakeholders – determined by the supervisory board and owners.
It includes relevant laws, guidelines, ethical codes, production processes, supply chain, declarations, a mission statement, or management practices. All communication in corporate governance reports should be clear and transparent to make it easily understandable for all shareholders.
For example, if you only want to invest in ethical companies, then references to sustainability, fairness, integrity, responsibility, or respect set the tone and are traits to look for in a company’s corporate governance report.
Top-down vs. bottom-up approach to fundamental analysis
There are two ways to approach fundamental analysis: the top-down (start with the study of the overall economy) and the bottom-up (begin with the analysis of individual companies).
- Top-down approach
A top-down approach to fundamental analysis starts from the economy’s overall strength, mainly looking at macroeconomic factors like interest rates, GDP levels, or inflation rates.

After determining the economy’s overall direction, investors would then try to specify which sectors or industries might perform best in such conditions and then identify and assess probable individual companies.
- Bottom-up approach
An alternative is a bottom-up approach; instead of starting the analysis from the state of the economy, it focuses on analyzing each company, then working its way to the overall economy and concentrating on various microeconomic factors.

Stock analysts often take this approach, arguing that specific companies often outperform the industry due to their solid financials or competitive advantage, so looking at the macroeconomic factors first wouldn’t make much sense.
Fundamental analysis investing strategies
Investors who base their primary investment decisions on fundamental analysis are generally these two strategies:
- Value investing: focus on whether the stock’s price might be undervalued or overvalued considering the company’s financial health, i.e., investigating its annual and quarterly financial reports in depth;
- Growth investing: focus on whether the stock is undervalued considering its future potential, e.g., do they have a unique selling point or a competitive advantage?
In conclusion
Fundamental analysis can be a beneficial tool for making investment decisions, depending on your investing style. However, it’s important to remember that conclusions are always subjective and should be approached with caution.
If you are following an analyst’s recommendations, familiarize yourself with who is behind these suggestions. What is more, even though corporate statements offer great insight into the company’s outlook, and approached with a sense of skepticism.
Disclaimer: The content on this site should not be considered investment advice. Investing is speculative. When investing, your capital is at risk.
Fundamental analysis FAQs
What is fundamental analysis?
Fundamental analysis is a method investors use to determine if assets or securities, most commonly stocks, are trading either above or below their fair market value, considering various economic and financial factors.
What is the difference between fundamental vs. technical analysis?
Fundamental analysis assumes that an asset’s current market price doesn’t account for all available information, and a study into financials and economic factors can help define the actual, fair value. On the other hand, technical analysis assumes the market price is already correct and instead attempts to forecast future prices by looking at historical price and volume data.
How to do fundamental analysis?
To do fundamental analysis, the first step of determining whether assets are under or overvalued is similar to research – investors search for all available information and conclude which could further affect the price. Depending on the approach, they either initially analyze the overall state of the economy and then define the assets, or focus on each company’s financial performance first.
What is qualitative and quantitative fundamental analysis?
Fundamental factors are divided into two categories: quantitative – all numerical data and metrics taken from financial reports, and qualitative – non-numerical aspects such as the company’s competitive advantage, management, or business model.