
As the crypto market monitors Bitcoin’s (BTC) next price trajectory and the possibility of breaching the $70,000 resistance, a trading expert has pointed out potential opportunities for investors to consider.
In a TradingView post on June 7, the analyst TradingShot highlighted a medium-term pattern that aligns with Bitcoin’s long-term bullish trend but contradicts the short-term market euphoria of recent days.
The analysis revealed key insights into potential buying opportunities based on historical price patterns and technical indicators.
According to TradingShot, the critical support level for potential buying opportunities lies within the range of the 50-day moving average (MA50) and the bottom of the green rectangle. This range is identified as the “buy zone,” where investors might consider accumulating Bitcoin.
The expert pointed out that since December 2022, Bitcoin has been moving within a dominant “Channel Up” pattern. Within this upward channel, it experienced its first significant correction through a rectangle pattern, identified as an accumulation phase.
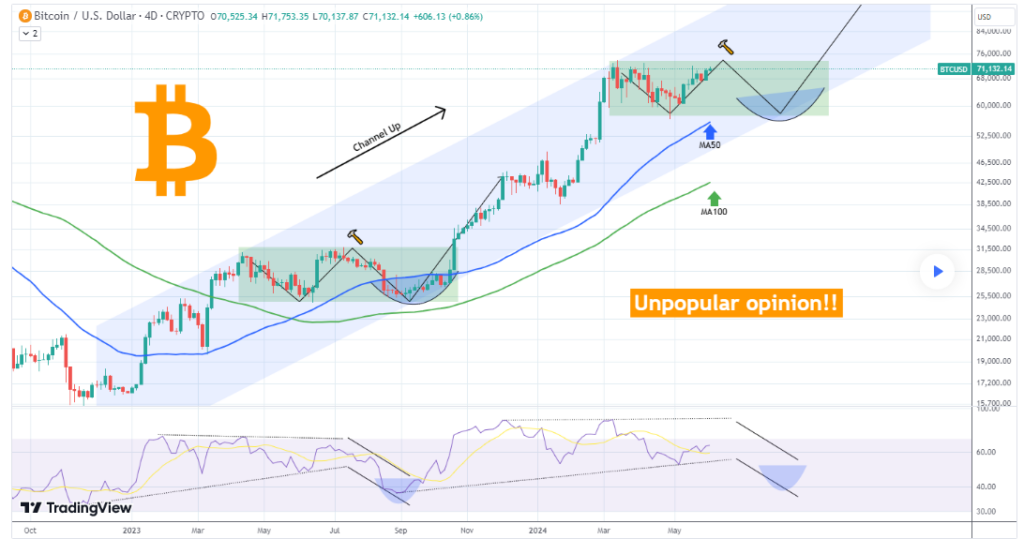
Bitcoin’s price found support during this phase, formed a bottom, and rose again after briefly dipping below MA50 and nearing the 100-day moving average (MA100).
Bitcoin’s rejection zone
TradingShot suggested that if a similar accumulation phase occurs again, Bitcoin might currently be at a ‘hammer’ rejection level at around $71,100, reminiscent of the price movement observed around July 12, 2023. The Relative Strength Index (RSI) patterns during these phases are notably similar, indicating potential buying opportunities.
It is worth noting that Bitcoin is experiencing a consolidation phase, with both bulls and bears tussling to influence the asset in either direction. Indeed, the pivotal focus is on whether Bitcoin can reclaim the $70,000 mark.
In this context, in an X post on June 7, crypto trading expert Michaël van de Poppe acknowledged that Bitcoin was still stuck in a range. He noted that the current trading pattern means that the leading cryptocurrency is ‘very heavily ready’ for a breakout in search of a new all-time high.
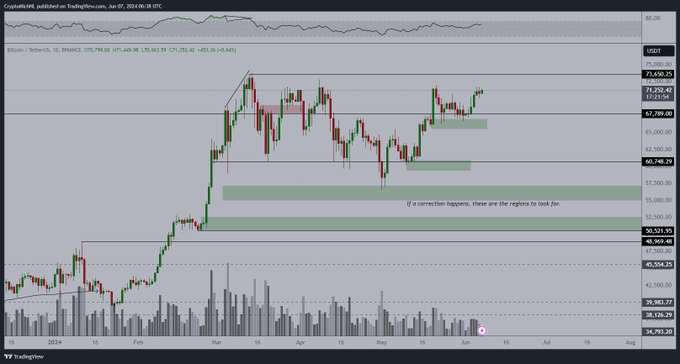
The analyst added that Bitcoin has also rejected the $71,600 level, and investors should expect a breakout in the coming week.
Bitcoin price analysis
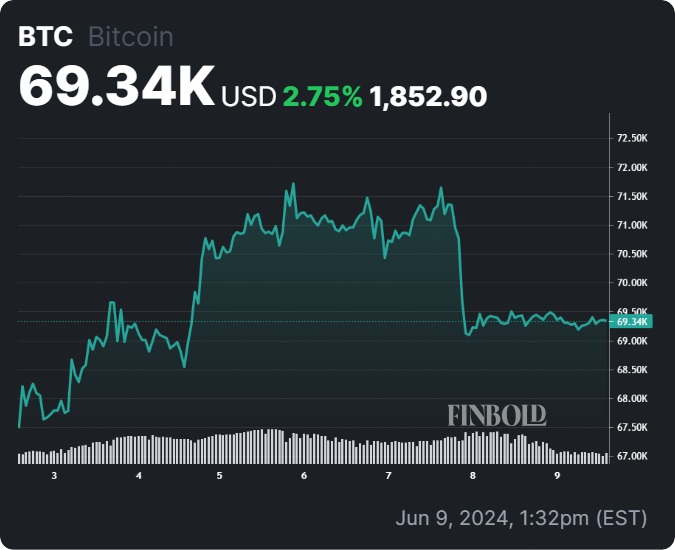
By press time, Bitcoin was trading at $69,340, having corrected by less than 0.1% in the past 24 hours. On the weekly timeframe, the crypto is up almost 3%.
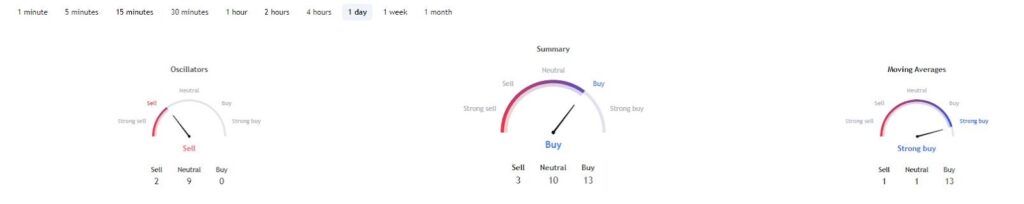
Despite the consolidation, Bitcoin’s technical analysis points to a bullish sentiment. A summary of the one-day gauges aligns with the ‘buy’ sentiment at 13, while moving averages indicate a ‘strong buy’ at 13. Oscillators are bearish, signaling ‘sell’ at 2.
In summary, as Bitcoin remains stuck in its current position, it is now up to the bulls and bears to dictate the asset’s next price action in search of a new all-time high.
Disclaimer: The content on this site should not be considered investment advice. Investing is speculative. When investing, your capital is at risk.