Microsoft (NASDAQ: MSFT) is on track to potentially reach the $500 mark by the end of 2024, driven by its strong financial performance and strategic investments in artificial intelligence (AI) and cloud computing.
The company’s Q4 2024 earnings report, which highlighted significant revenue growth and increased net income, has reinforced investor confidence. A key driver of this momentum is the integration of OpenAI’s ChatGPT into Microsoft’s Azure platform, significantly enhancing its AI capabilities.
Moreover, the acquisition of Activision Blizzard has strengthened Microsoft’s position in the gaming industry, unifying PCs and Xbox under the Microsoft Pass. These strategic moves are expected to fuel further growth and profitability.
In this context, trading expert Tradingshot highlighted that technical indicators and historical price movements suggest that Microsoft could hit $500 by year-end.
Key moving averages and potential breakouts
According to the analysis, the stock has maintained a robust upward trajectory within a well-defined ‘Channel Up’ pattern since January 2023, consistently forming higher highs and higher lows, which signals sustained bullish momentum.
The recent recovery, which saw MSFT reclaim nearly all of August’s losses, has established a new long-term bottom. This marks a higher low within the 20-month Channel Up, indicating continued upward movement.
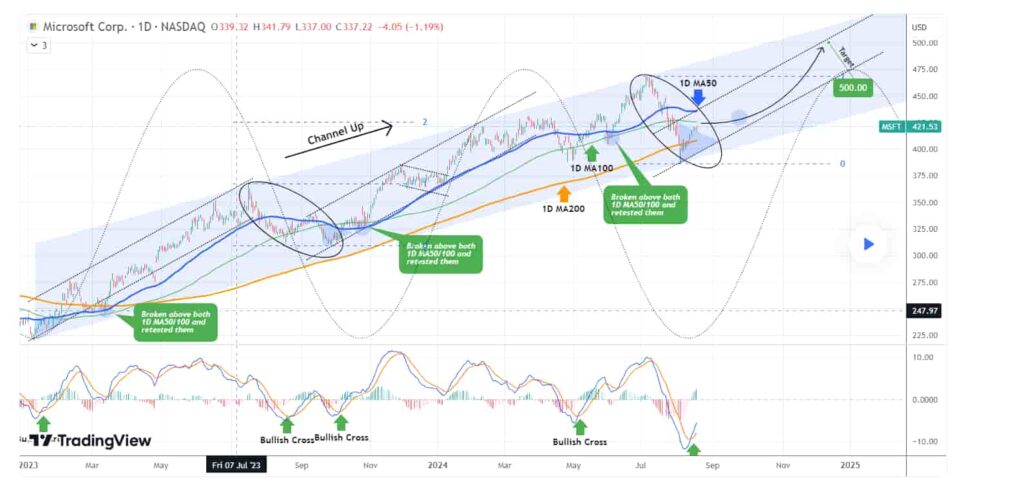
Currently, MSFT is consolidating just below the 100-day moving average (1D MA100), a critical technical level that has historically been a precursor to significant upward moves.
A breakout above this moving average would likely signal the start of a new bullish phase.
Historically, in previous bullish legs within this Channel Up, MSFT has retested the cluster of the 50-day and 100-day moving averages (1D MA50/100) after breaking out, establishing them as new long-term support.
This retest is crucial for confirming the bullish momentum, and investors should closely monitor these levels.
In addition to the moving averages, the Moving Average Convergence Divergence (MACD) indicator has recently formed a bullish crossover on the daily chart, particularly below the zero line.
In the past, such crossovers below 0.0 have consistently marked strong buy signals, leading to significant price rallies. This bullish crossover reinforces the positive outlook for MSFT, signaling that the stock may be at a pivotal point where it could launch into its next upward leg.
Moreover, the chart also indicates other bullish crossovers, including the price action crossing above key moving averages, which historically precedes sustained rallies.
These crossovers, particularly when aligned with the MACD signal, further confirm that MSFT is in a strong position to continue its upward trend.
MSFT stock key levels to watch
The upper boundary of the long-term Channel Up suggests a price target of $500 by the end of the year.
The $500 level is not only the upper boundary of the channel but also sits below the 2.0 Fibonacci extension level, derived from the March higher high.
This indicates that $500 remains within a conservative range, given the broader technical setup. Investors should also be aware that if bullish momentum intensifies, the stock could move beyond this level.
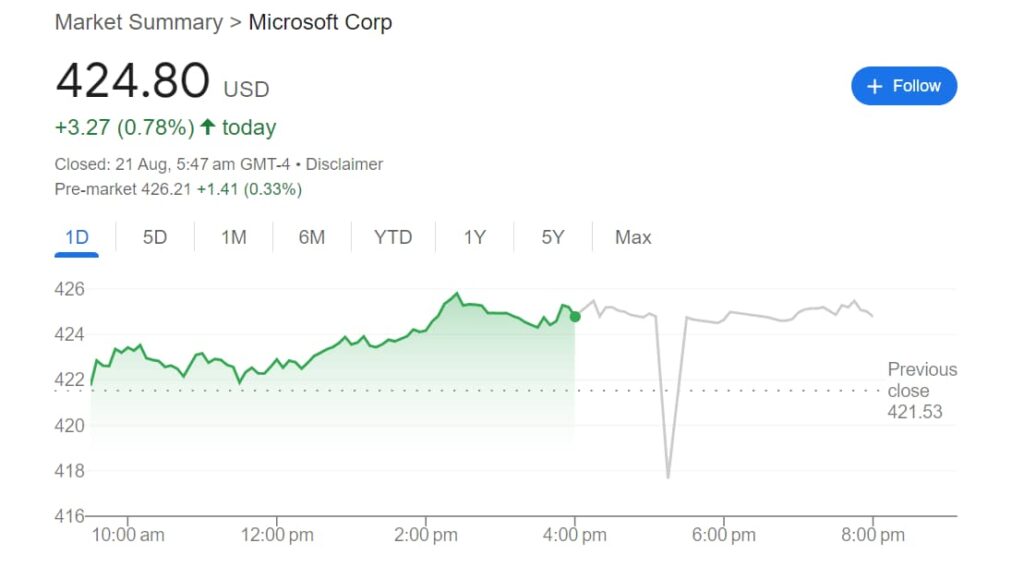
Looking at its performance in 2024 so far, MSFT stock has risen 13.63% on a year-to-date basis, with the previous five trading days bringing a 2.41% gain and a 0.6% gain in the latest trading session on August 20, settling the price per share at $424.80.
Investors and traders should focus on key levels, particularly the breakout above the 100-day moving average and the retest of the 50-day moving average, to confirm the continuation of the bullish trend.
Entering positions near these levels could offer optimal risk-reward opportunities, with the $500 target presenting substantial upside potential.
Disclaimer: The content on this site should not be considered investment advice. Investing is speculative. When investing, your capital is at risk.