IOTA (MIOTA) is a crypto based on a distributed ledger technology (DLT) crafted explicitly for the Internet of Things (IoT) ecosystem. The platform facilitates secure and feeless exchange of data and value among machines and devices within the Internet of Things (IoT) environment.
During an AMA session on January 24, Dominik Schiener, the founder of MIOTA, delivered a significant announcement that resulted in a 12% surge in the price of this crypto the previous day.
The revelation pertained to the upcoming launch of the IOTA Ethereum Virtual Machine (EVM) on March 31 and the introduction of the new alpha version of IOTA, v1.0.0-alpha.2 pre-release.
Picks for you
IOTA technical analysis
Due to the recent gains, technical analysis might provide investors with further detailed insights on potential future price movements.
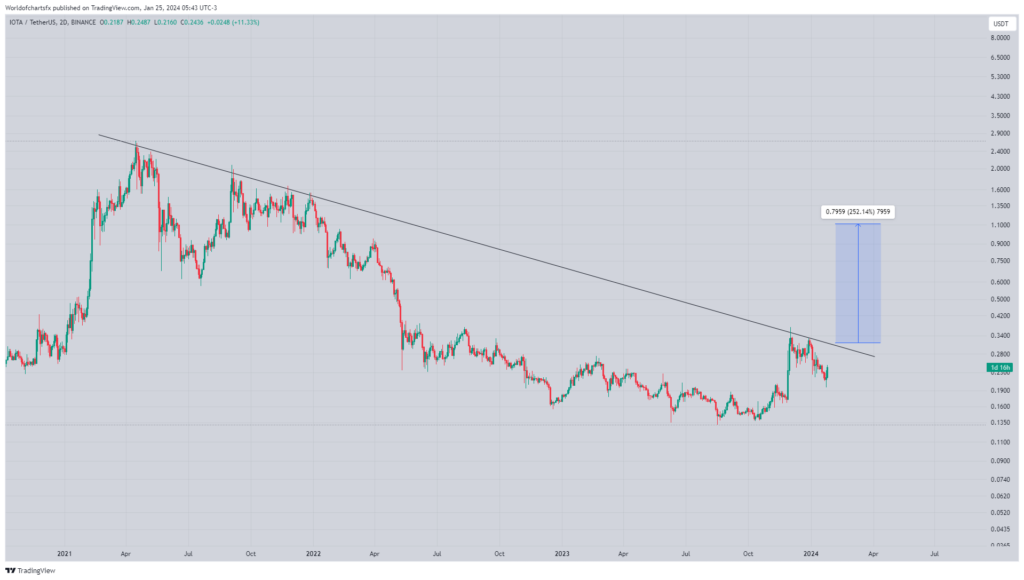
The current trend indicates an approach towards a multi-year descending trend line. There is anticipation of a potential breakout, and in the event of a successful breakout, a substantial bullish rally is expected, with a midterm target projected towards $1.20, as per a post on X from cryptocurrency analyst World of Charts on January 25.
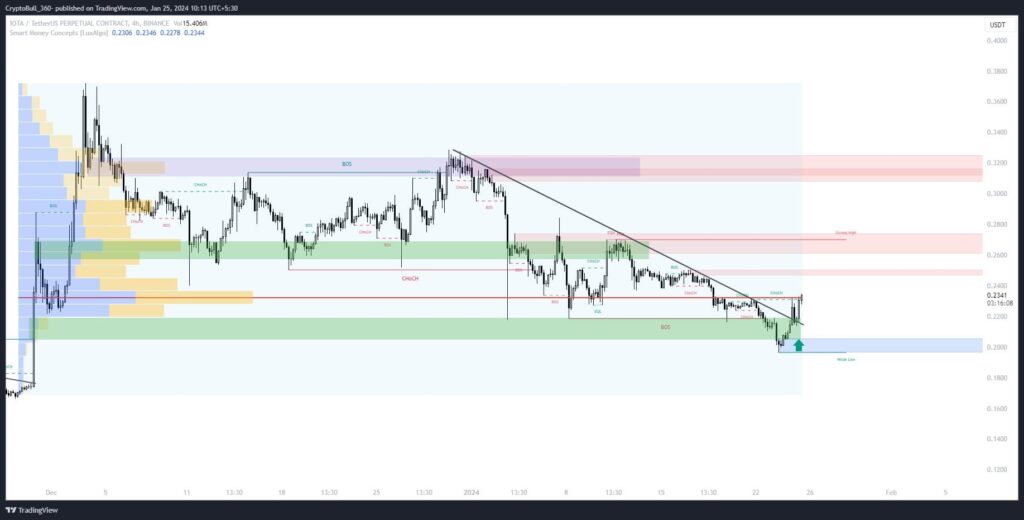
Additionally, MIOTA looks poised for a short-term breakout from several resistance zones. A decisive close above the Point of Control (PoC) volume zone is anticipated to initiate a bullish rally. The increasing volume also indicates positive momentum, per a CryptoBull post on January 25.
IOTA price analysis
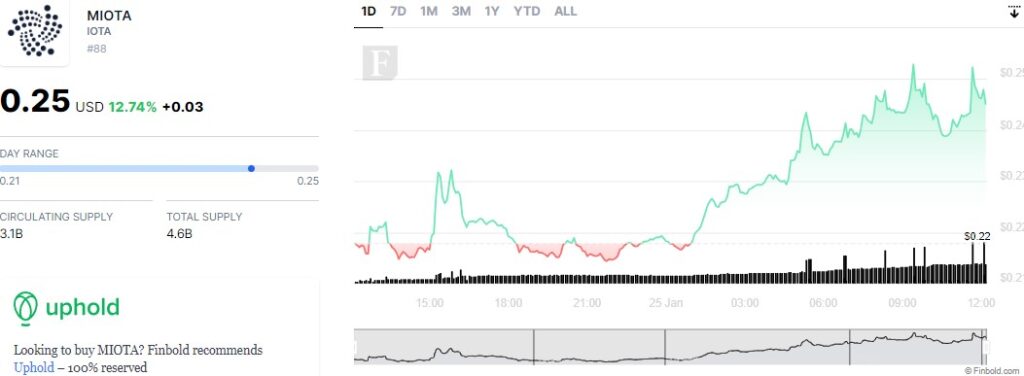
At the time of press, IOTA was trading at $0.2437, after an increase of 12.74% in the past 24 hours, adding to 2.13% gains made over the past week, contrary to losses of -14.21% in the previous month.
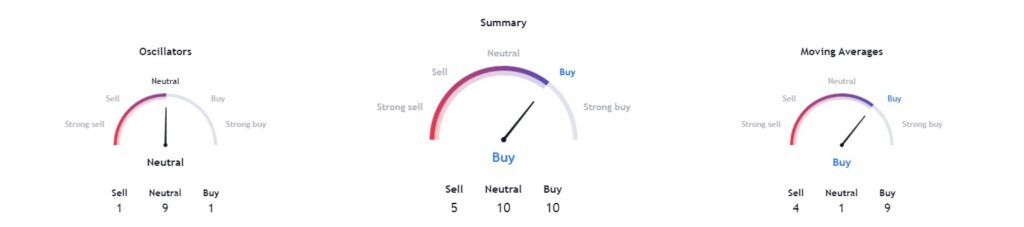
As for the technical indicators, they have an overall sentiment of ‘buy’ at 10, with moving averages tilting towards ‘buy’ as well at 9. Oscillators are ‘neutral’ at 9.
With the recent surge in price, technical indicators and chart patterns seem swayed in IOTA’s favor. Whether the recently announced innovations will propel the price of this digital asset even further remains to be seen.
Disclaimer: The content on this site should not be considered investment advice. Investing is speculative. When investing, your capital is at risk.