Saying that Nvidia (NASDAQ: NVDA) was the stock market star of 2024 would be unfair largely due to the fact that the company’s shares have been doing exceedingly well – almost without pause – since late 2022.
Nonetheless, NVDA shares have also managed to break records and have, since the New Year, managed to maintain their longest-ever winning streak totaling 11 weeks which saw it surge from $481.68 to as high as $962.
The streak has, with the market’s closing on Thursday, March 29, come to an end with Nvidia recording its first red trading week this year leaving the question open: will the stock now crash and, if so, how low could it go?
Picks for you
Will Nvidia crash?
While it is difficult to tell exactly how much Nvidia stock might crash after the end of its winning streak, the latest support and resistance levels for the semiconductor giant offer some insights into the possible upcoming market moves.
Indeed, with the latest closing price of $903.56, NVDA shares are relatively close to their first support level of $892.66. and might, as soon as Friday, break below it. The third support – the final level before Nvidia reaches the potential of plunging into the unknown – is somewhat farther at $871.59.
It is important to note, however, that while the third support is not commonly discussed due to it being the most distant and, often, the strongest level, it may be less indicative when it comes to Nvidia.
Indeed, the way the blue-chip chipmaker has been trading has made utilizing more traditional methods tougher, and, indeed, NVDA shares last stood below their current third resistance as recently as March 11 – less than three weeks before the time of publication.
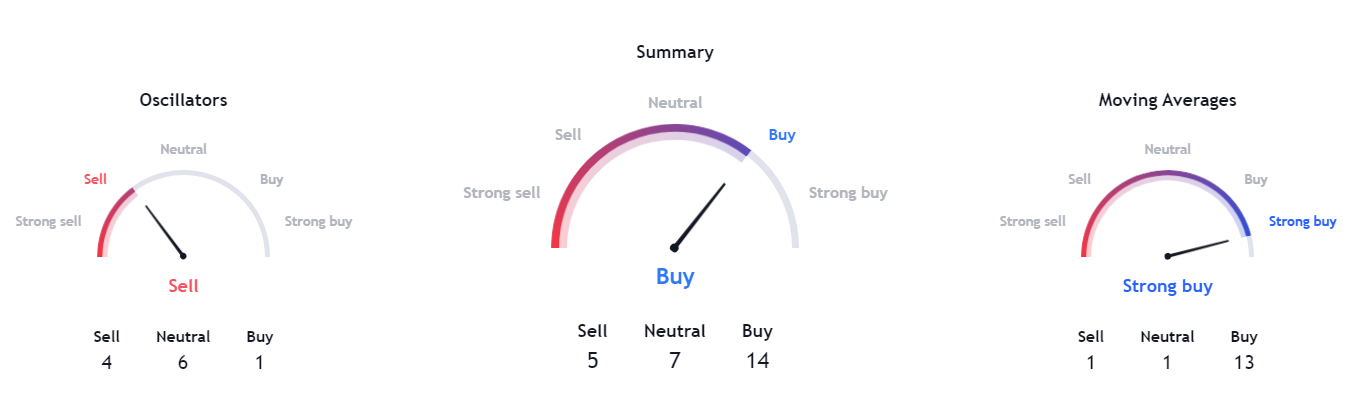
Additionally, despite the latest slight downtrend, technical analysis (TA) remains generally rather bullish when it comes to Nvidia shares. When derived from NVDA’s daily and monthly performance, oscillators retrieved from TradingView are neutral, but moving averages (MA) read “strong buy.”
When based on the weekly chart, MA remains unchanged but oscillators flip to “sell.”
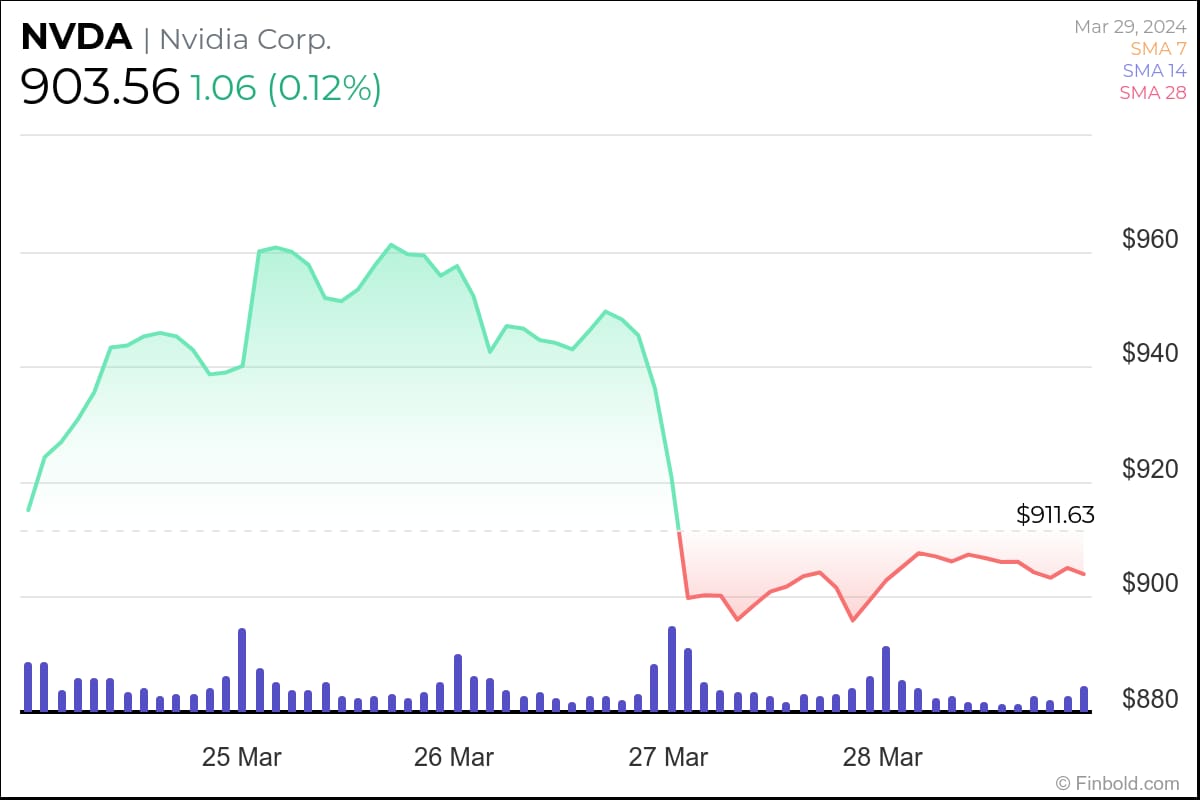
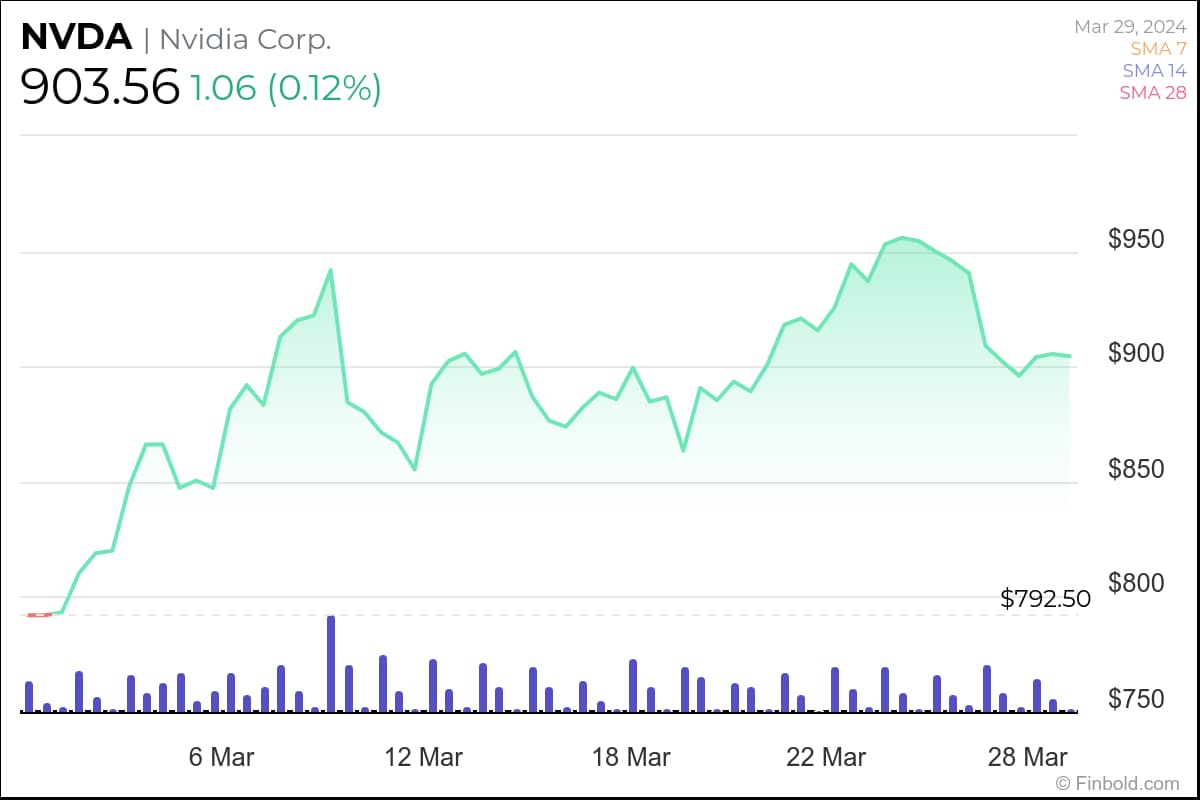
NVDA stock price chart
Despite the weekly decline, Nvidia is still significantly in the green in most time frames. At press time, NVDA is up 87.59% since January 1, and as much as 234.85% in the green in the last 52 weeks.
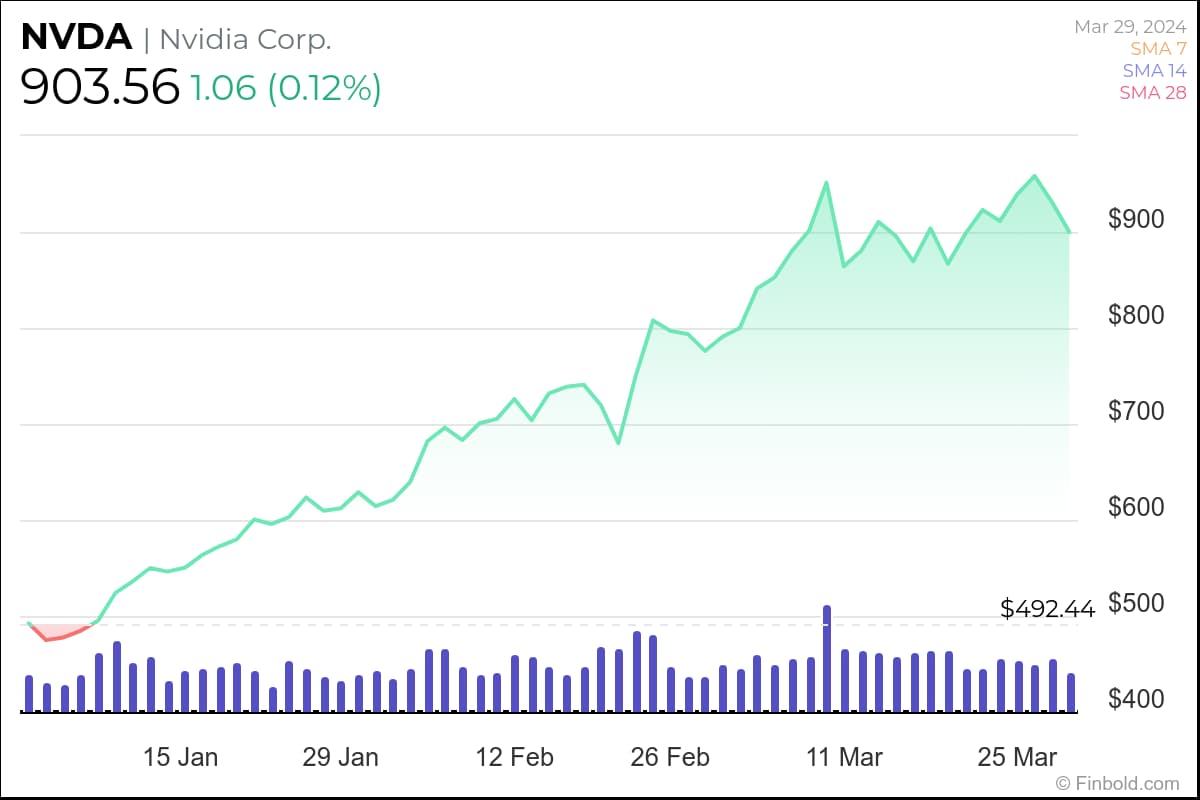
Barring the weekly decline of 0.86%, Nvidia is also in the green in the last 30 days – by 14.21% – and managed to climb 0.12% to $903.56 during Thursday trading. In Friday’s premarket, however, Nvidia stock price today is down 0.26% by the time of publication.
Buy stocks now with eToro – trusted and advanced investment platform
Disclaimer: The content on this site should not be considered investment advice. Investing is speculative. When investing, your capital is at risk.