Solana’s (SOL) current rally will likely culminate in another record high, with the decentralized finance (DeFi) project mirroring past trading patterns.
Notably, in an X post on July 26, crypto trading expert Ali Martinez drew striking parallels between Solana’s current price movement and a historical pattern from July 2021, suggesting a substantial price increase to $1,000 could be imminent.
Martinez’s analysis compares two key charts showcasing Solana’s price behavior between 2024 and 2021. Both charts display a consolidation phase followed by a breakout, implying a potential major price surge.
In July 2021, Solana experienced a significant price rally, catapulting from around $27 to an all-time high of $260. This 717% increase was driven by a strong technical breakout from a descending triangle pattern, a bullish formation often indicating a trend reversal or continuation.
Currently, Solana is trading at approximately $178, having broken out from a similar descending triangle pattern. The technical setup appears identical to the one observed in 2021, suggesting another exponential price increase could be on the horizon.
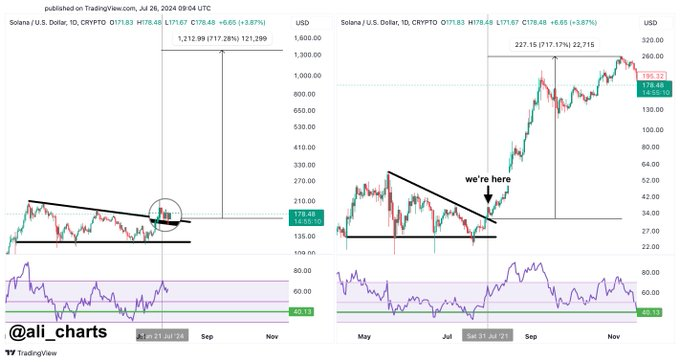
Martinez’s analysis highlights that the cryptocurrency could reach the $1,000 mark if Solana replicates its past performance. This target is based on the historical pattern and the measured move technique, which involves calculating the triangle’s height and projecting it from the breakout point.
The Relative Strength Index (RSI), a momentum indicator used to assess overbought or oversold conditions, also supports this bullish outlook. In both 2021 and 2024, the RSI has rebounded from the 40 level, indicating a shift from bearish to bullish momentum.
Solana on a bullish trendline
Notably, Solana’s price has started a decent upward move from the $165 support, with the token targeting the $200 zone, which could open the door for another all-time high. The target of $1,000 remains possible, considering the bullish sentiments surrounding the crypto. For instance, there is speculation about a possible spot Solana exchange-traded fund (ETF) that could drive significant capital into the asset.
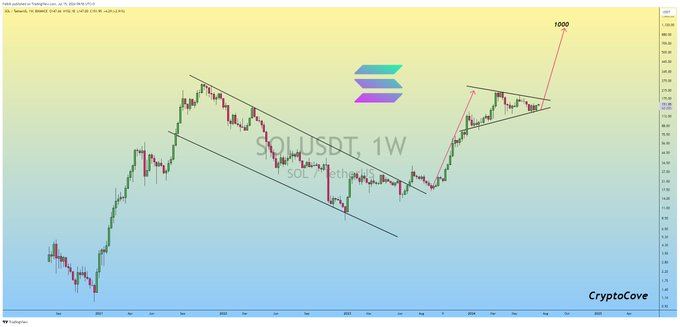
Indeed, the target of $1,000 is also backed by another analysis by Captain Faibik in a previous X post on July 15, where he noted that following a prolonged downtrend until early 2023, Solana has been on a recovery path, breaking out of a descending channel and forming an ascending pattern. This movement projects a possible rally of $1,000.
SOL price analysis
By press time, Solana was trading at $179 with daily gains of over 6%. On the weekly chart, SOL is up 11%.
As Solana looks to sustain its bullish momentum, investors should watch the $175 support and the $180 resistance.
Disclaimer: The content on this site should not be considered investment advice. Investing is speculative. When investing, your capital is at risk.