
As Bitcoin (BTC) continues to struggle with breaking above any significant level, with a similar situation plaguing most of the other assets on the cryptocurrency market, certain chart patterns are keeping the hope alive that things may soon turn around.
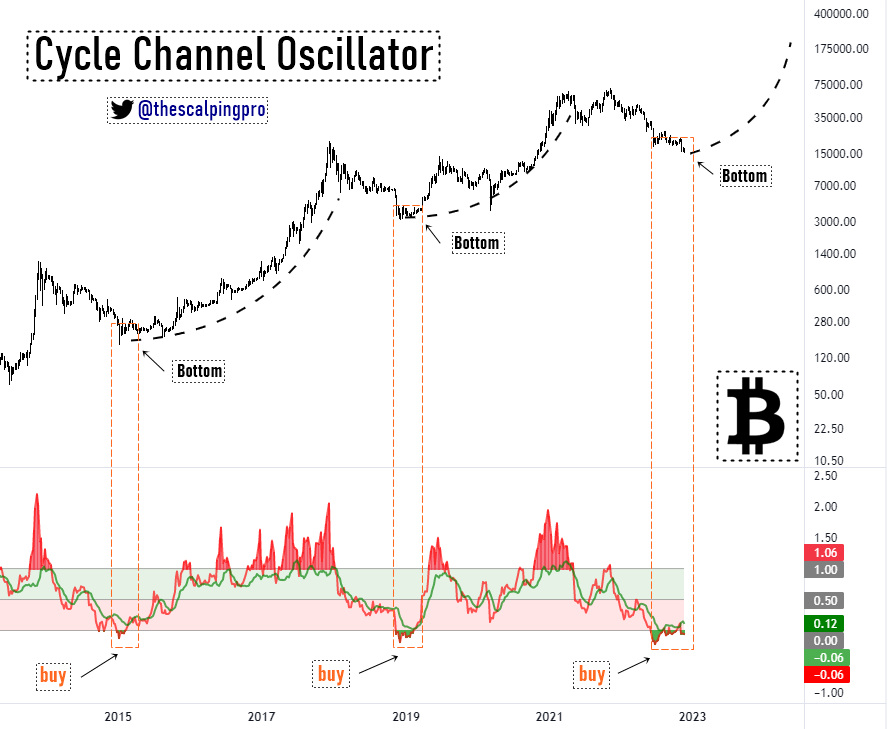
Indeed, the cycle channel oscillator (CCO), which typically indicates the oversold area and market bottoms for Bitcoin, has entered the bear market bottom and a “perfect area to DCA BTC,” according to the analysis by the pseudonymous crypto expert Mags published on November 27.
Talking about DCA (dollar cost average), the crypto expert referred to the practice, familiar in both crypto and stock market circles, of continuously investing a small, set amount of money, which may lead to better results over time.
Per the chart shared by the analyst, the current Bitcoin bottom could finally lead the price of the flagship decentralized finance (DeFi) asset to make a bullish push, reaching the level of $17,500 (and eventually beyond it) sometime in 2023.
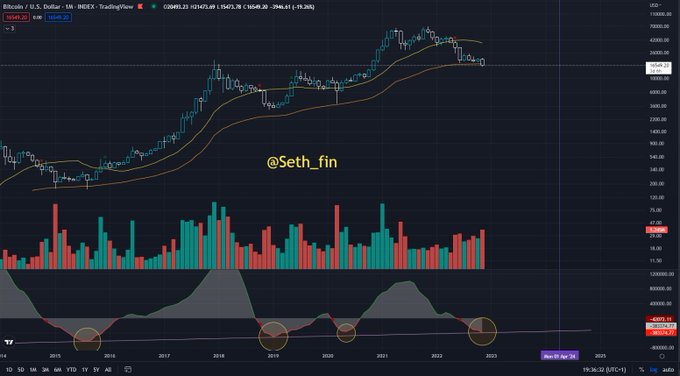
Furthermore, Mags retweeted an analysis by a finance analyst known as Seth, who explained that BTC monthly chart was “showing we are at the same accumulation phase as the last major bottoms,” adding that “we are also at the same monthly MA as the last bottoms.”
Bitcoin technical analysis
Meanwhile, the technical analysis (TA) one-week gauges are painting a somewhat different picture, as their summary is currently suggesting ‘sell’ at 13, as opposed to 4 indicating ‘buy’ and 9 for ‘neutral.’
This summary is the result of moving averages (MA) standing in the ‘strong sell’ zone at 13 (compared to 1 for both ‘neutral’ and ‘buy’) and, interestingly, oscillators moving in the opposite direction and indicating ‘buy’ at 3, as opposed to 8 for ‘neutral’ and no sell signals.

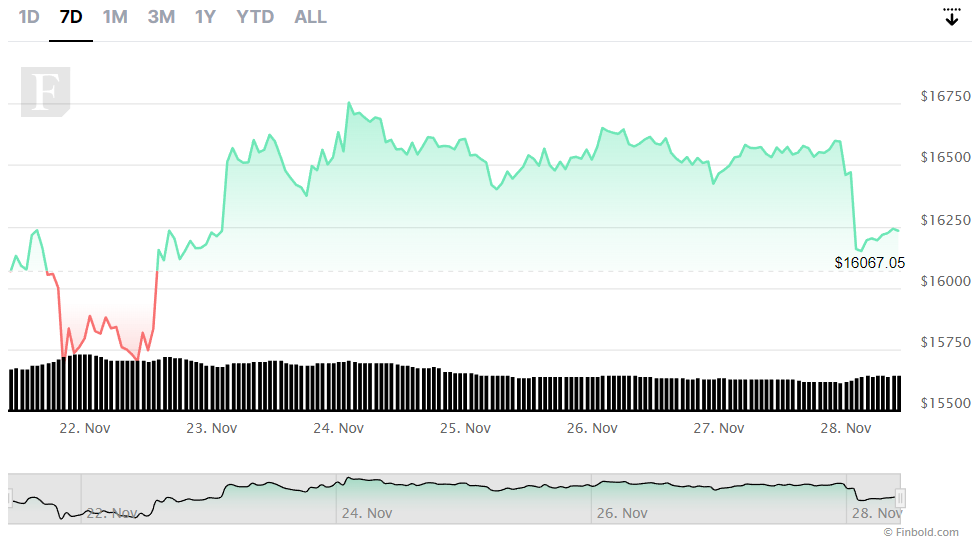
At press time, Bitcoin was changing hands at the price of $16,244, down 1.71% on the day but still recording a growth of 1.41% compared to the previous seven days, as per data retrieved on November 28.
As such, the maiden crypto token is yet to reach the crucial resistance level at around $16,600, which the prominent crypto trading expert Michaël van de Poppe said it needs to reclaim to form a “candle towards $17.5-18K,” as Finbold reported.
Disclaimer: The content on this site should not be considered investment advice. Investing is speculative. When investing, your capital is at risk.