Despite facing challenges over the past year, Polygon (MATIC) showcases the potential to turn the tides and embark on the road of gains.
The established support levels on higher time frames have demonstrated resilience, and liquidity has been successfully acquired. Anticipating a potential upward movement, it is noteworthy that MATIC has exhibited a relative underperformance.
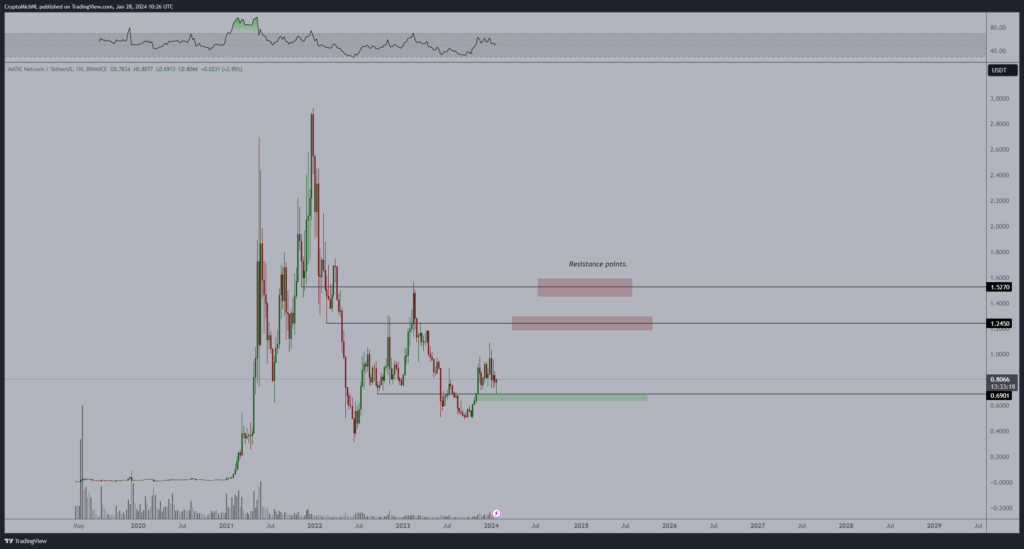
The forthcoming rally is projected to target the range of $1.25 to $1.50, according to a post on X from cryptocurrency expert Michael van de Poppe on January 28.
“I’m expecting another upwards push, although $MATIC has also been underperforming. Next rally could be to $1.25-1.50 region.”
Fundamental and technical indicators
In the recent time frame, Polygon is printing an interesting pattern and showcasing characteristics that spell out sound technical and fundamental performance.
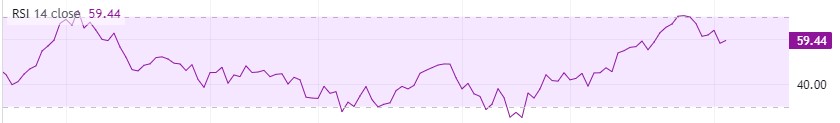
Notable among these are a prolonged downward movement spanning several weeks, favorable accumulation patterns, and positive momentum, as suggested by the RSI value.
Furthermore, the recent correction saw the price precisely decline to the daily Order Block (OB), where consolidation occurred. This trend signifies the strength of buyer (long) positions and a concerted effort by major players to accumulate the asset.
Despite the low volume of purchases, the digital assets performance remains robust. Anticipation of increased volumes raises the likelihood of a notable surge in the token’s value.
Polygon price analysis
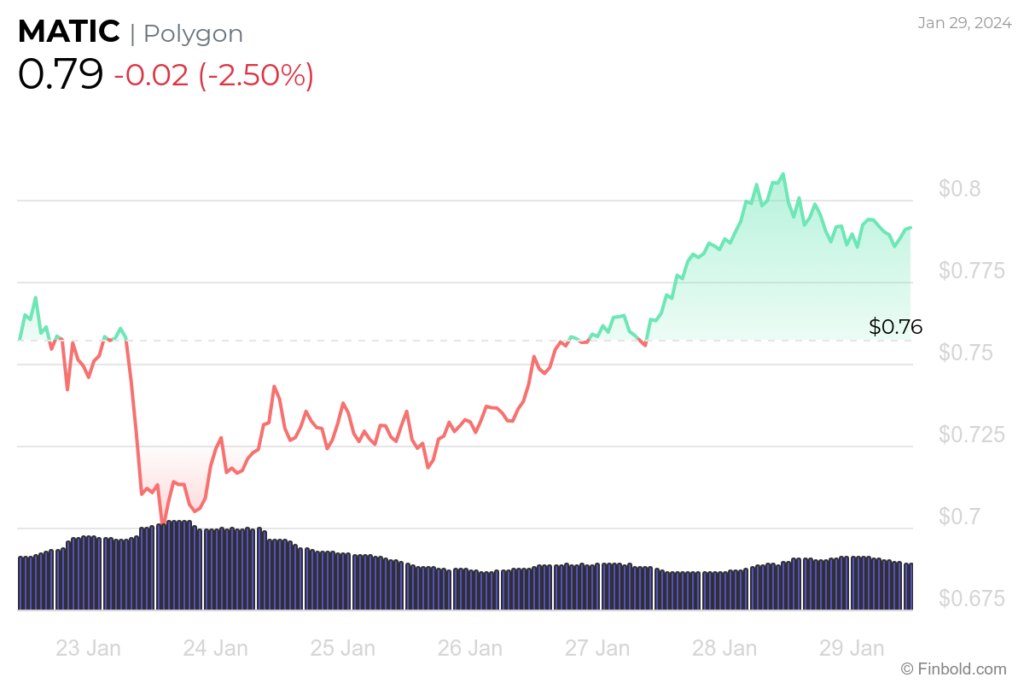
At the time of press, MATIC was trading at $0.7889, marking a decrease of -2.50% in the past 24 hours, contrary to the gains of 3.87% in the past week. However, this crypto lost -21.55% in the previous month.
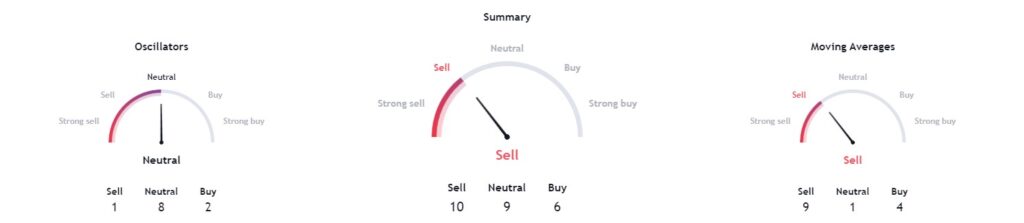
As for the technical indicators, they are pretty bearish on Polygon, with a rating of ‘sell’ at 10. With moving averages pointing to ‘sell’ at 9. Oscillators showing ‘neutral’ at 8.
With the current opportunity possibly being ‘buy the dip,’ investors should exercise caution when allocating resources and conduct thorough research and analysis.
Disclaimer: The content on this site should not be considered investment advice. Investing is speculative. When investing, your capital is at risk.