Nvidia (NASDAQ: NVDA) has become a focal point in recent market discussions, particularly due to its volatile price movements and anticipation of its upcoming earnings report.
Recently, Nvidia has seen bullish momentum, pushing the semiconductor stock to the $130 mark amid a significant capital swing in the equity. However, on August 20, NVDA experienced a downturn, closing the day at $127, reflecting a 24-hour loss of about 2%. Despite this, the stock posted weekly gains of approximately 7%.
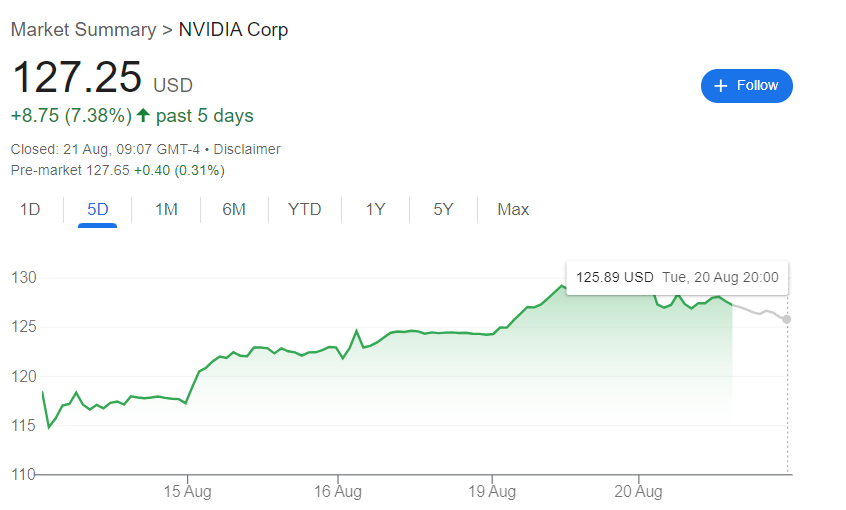
Despite the short-term price fluctuations, analysts’ consensus suggests that the NVDA will likely see further upside in the coming days, bolstered by the highly anticipated Q2 2024 earnings report.
NVDA share price prediction
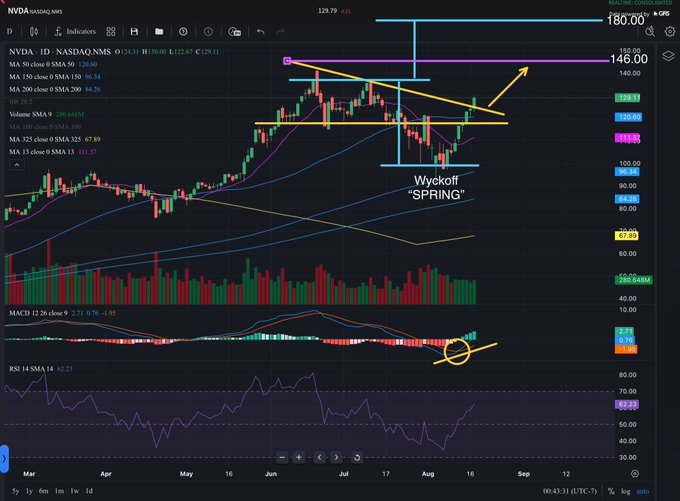
Notably, analysis by trading expert Banana3 in an X post on August 20 shed light on a potential trajectory for Nvidia’s stock price, setting a target of $146 in the post-earnings period.
According to the expert, Nvidia’s recent price action can be understood through technical analysis, particularly by examining the daily chart. The analysis begins by highlighting a significant decline from $140 to $90, representing a $50 drop.
Using a measured move calculation, the expert projected a potential rise by adding $50 to the $140 mark, resulting in a target of $190. However, factoring in a 5% risk premium ($9.50), the long-term measured move target adjusts to $180.50.
The analysis emphasized that the recent breakout from the flag pattern was a strategic undercut of liquidity, suggesting many stop-loss orders were clustered around the flag pattern’s lower boundary.
Other Nvidia indicators for a breakout
Additionally, the expert drew a parallel between the current situation and the Wyckoff “Spring,” a concept in technical analysis where a stock’s price undergoes a sharp drop to shake out weak hands before a significant upward movement.
This concept is evident in the recent price action, which shows a clear “Spring” event where the price dipped below support but quickly rebounded.
Simultaneously, the Moving Average Convergence Divergence (MACD) indicator for Nvidia is beginning to show a bullish crossover, which could signify that the stock is gaining momentum.
Similarly, the Relative Strength Index (RSI) has bounced from oversold levels, supporting the fact that Nvidia may be gearing up for a rally.
Banana3’s forecast for Nvidia’s earnings target is a modest 3% above previous highs, aligning with the $146 short-term target. However, the expert also noted that this would represent a 55% increase from recent lows, highlighting the potential for significant gains if the stock continues on its current trajectory.
Impact Nvidia Q2 2024 earnings
Overall, Wall Street analysts maintain that Nvidia is poised to report strong Q2 2024 earnings, scheduled for August 28.
The tech giant’s graphics processing chips, the benchmark for running generative artificial intelligence (AI) workloads, continue to see robust demand. Based on this outlook, analysts from entities such as Goldman Sachs (NYSE: GS) have maintained a ‘buy’ rating for the stock.
Buy stocks now with eToro – trusted and advanced investment platform
Disclaimer: The content on this site should not be considered investment advice. Investing is speculative. When investing, your capital is at risk.