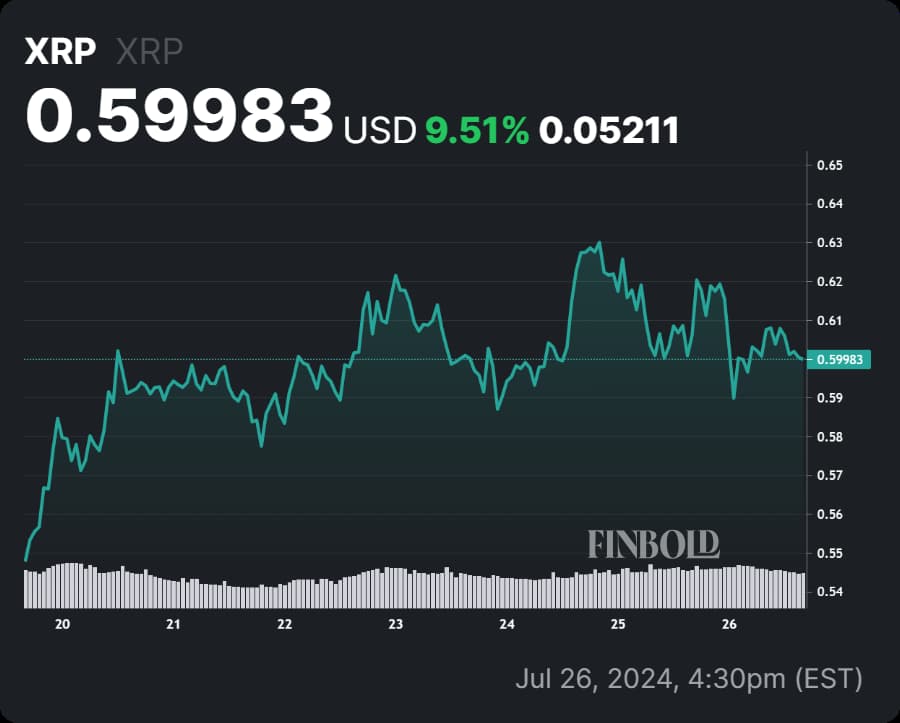
In recent days, the cryptocurrency market has been brimming with activity surrounding XRP (XRP), indicating a potential rebound after prolonged consolidation. Investors are keenly observing whether XRP can hold above the critical $0.60 mark, a significant psychological level.
Notably, XRP has maintained a bullish trend, significantly outperforming Bitcoin (BTC) with a 26% rise over the past month compared to Bitcoin’s 9% increase.
This strong performance underscores XRP’s growing resilience and market strength. Adding to the optimism, there is speculation about a possible settlement between Ripple and the United States Securities and Exchange Commission (SEC), which could further boost XRP’s price.
As it happens, crypto expert Dark Defender, in a July 25 X post (formerly Twitter), indicated a bullish outlook for XRP, suggesting that the token could experience a significant price increase soon.
Technical analysis and insights
According to Dark Defender’s analysis, the weekly chart of XRP reveals a crucial breakout above the $0.6044 level, coinciding with the upper boundary of the Ichimoku Clouds.
Notably, the Ichimoku Cloud is a technical indicator used to show support and resistance levels, as well as momentum and trend direction.
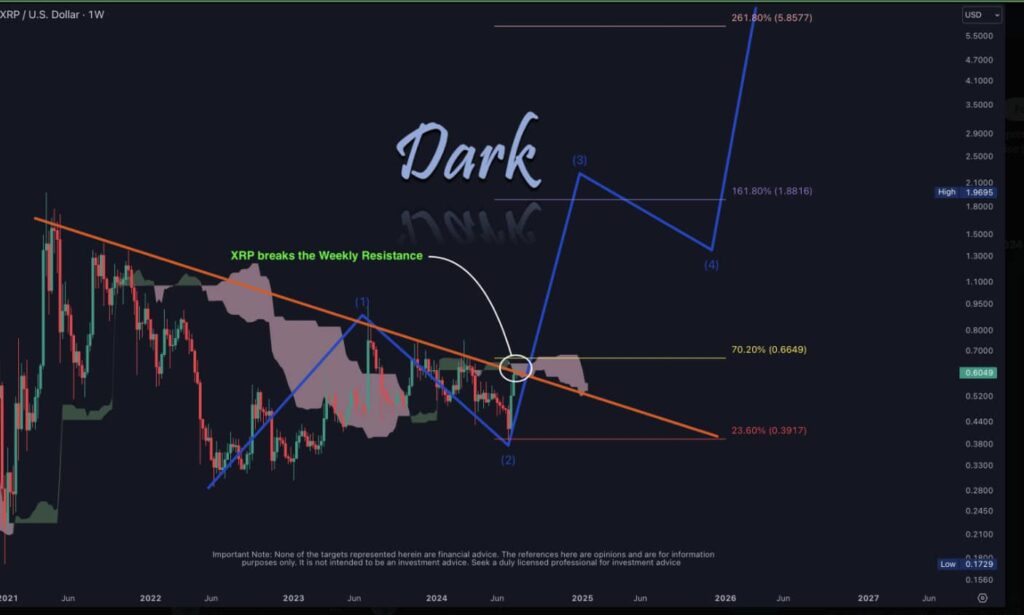
This breakout is a vital technical indicator, signaling the potential for further upward movement. The next significant target is around $0.66, which aligns with the 70.20% Fibonacci retracement level.
Beyond $0.66, the next major resistance level is at $1.9695, corresponding to the 161.80% Fibonacci extension level.
Surpassing this level could affirm a robust bullish trend. Ultimately, the long-term target is at $5.8577, which represents the 261.80% Fibonacci extension level, suggesting a possible significant price surge.
On the downside, $0.6044 now acts as a strong support level, having flipped from the previous resistance.
Maintaining this level is crucial for sustaining the bullish momentum. Further support is found at $0.3917, the 23.60% Fibonacci retracement level, with the historical support at $0.1729, providing a strong price floor.
XRP price analysis
XRP is currently trading at $0.599, a decrease of 0.97% in the past 24 hours. Technical indicators and patterns suggest XRP is on the verge of a significant upward move.
Investors and traders should watch for a confirmed breakout above $0.66, which could lead to further gains.
Additionally, a potential Ripple-SEC settlement could boost XRP’s price. Given the current momentum, XRP appears bullish, but investors should remain vigilant for any reversal signs and conduct thorough due diligence when making investment decisions.
Disclaimer: The content on this site should not be considered investment advice. Investing is speculative. When investing, your capital is at risk.