Following a brief pause in the last weeks of December 2023, non-Bitcoin (BTC) cryptocurrencies, otherwise known as altcoins, entered 2024 with a slowdown, presenting potential ‘buy the dip’ opportunities for the first month of this year.
The persistent ascent of Bitcoin to a market value of $45,800, reaching its highest point since April 2021, has catalyzed a positive trajectory for various altcoins in the early months of 2024.
Notably, several breakout assets adhere to well-defined social volume patterns. Without excessive fear of missing out (FOMO), the potential for substantial continued growth in altcoins exists, as per a crypto analysis platform Santiment post on X on January 2.
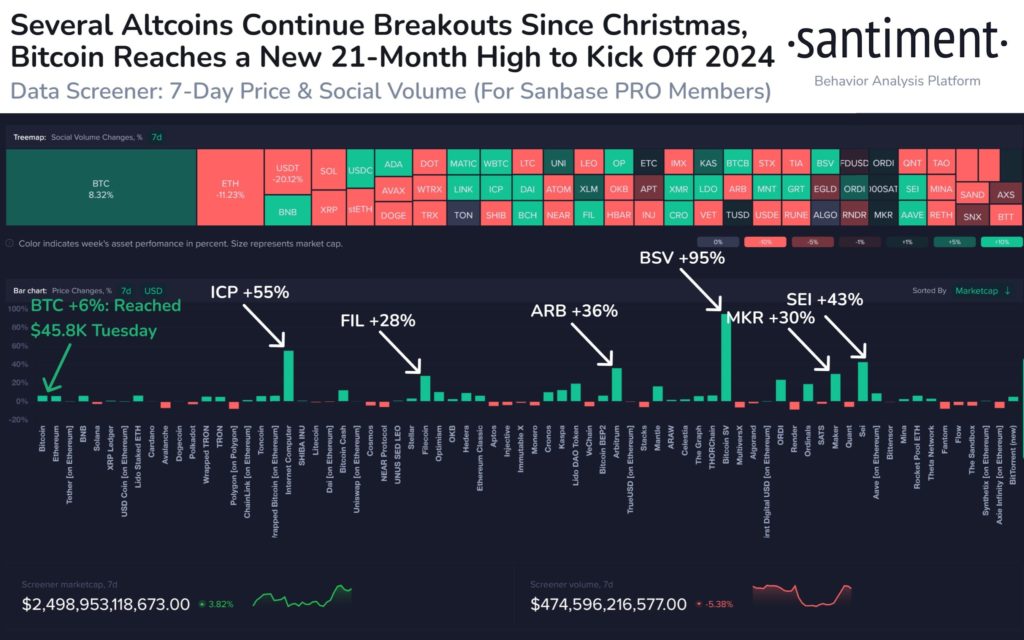
Finbold identified 7 altcoins with the best potential to capitalize on Bitcoin gains and present investors with a potentially profitable buying opportunity.
Ethereum (ETH)
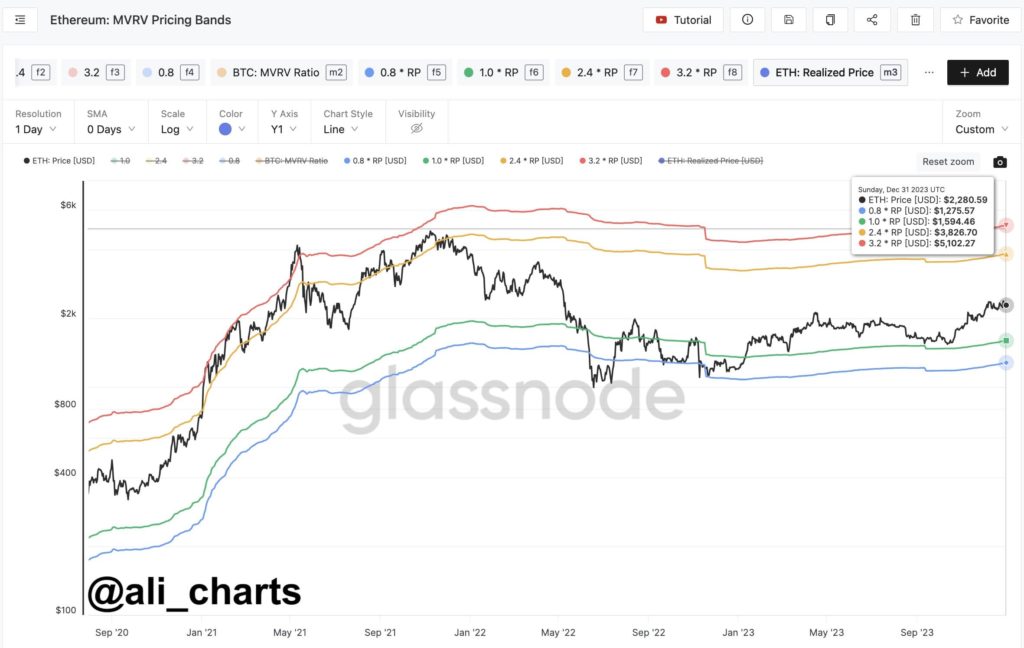
MVRV comparison enables an assessment of whether the current price is above or below the perceived “fair value,” providing insights into market profitability. Per the Ethereum (ETH) MVRV Pricing Bands, ETH’s upcoming significant price targets are identified at $3,830 and $5,100, per a post from crypto analyst Ali Martinez on January 2.
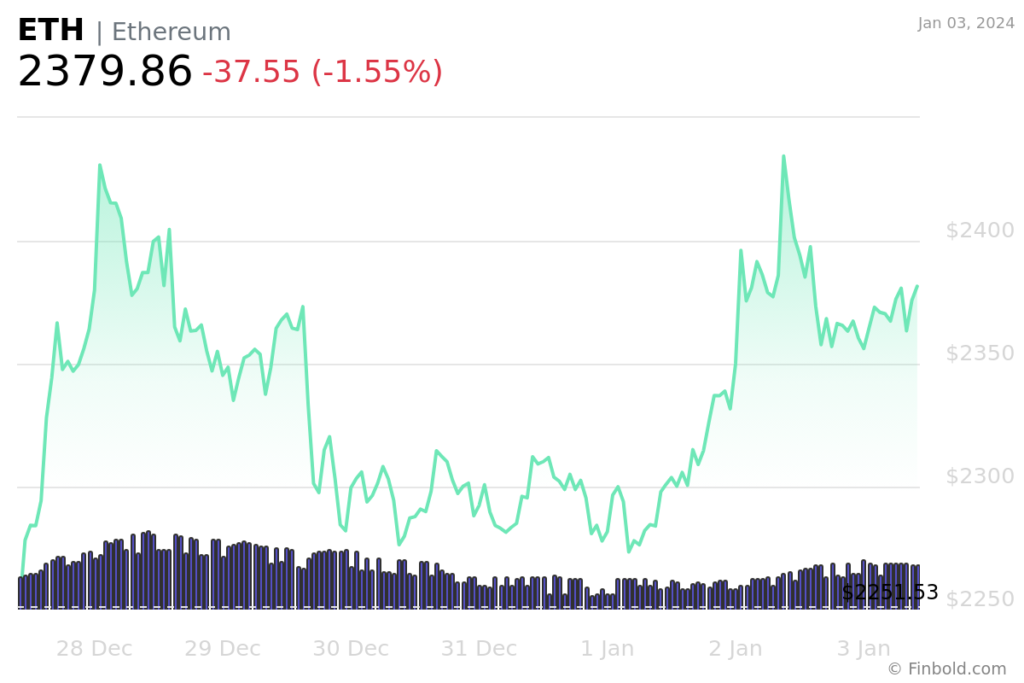
In the meantime, Ethereum is changing hands at $2,379, which represents a decrease of -1.55% on the day, a positive price change of 5.84% across the past week, and a 5.38% advance on its monthly chart, according to the latest information retrieved on January 3.
XRP (XRP)
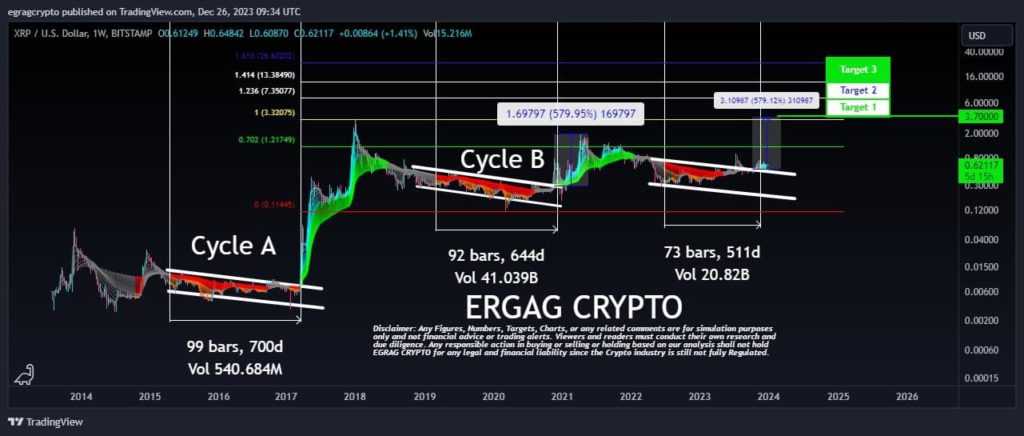
XRP (XRP) is potentially poised for a significant surge, with the potential to reach $3.7 if historical patterns, particularly those observed with the Super Guppy indicator, which is an advanced version of the GMMA created by Chris Moody, employs seven short-term and 15 long-term averages for enhanced trend identification and trading signals, repeat themselves, according to crypto expert EGRAG CRYPTO post on December 28.
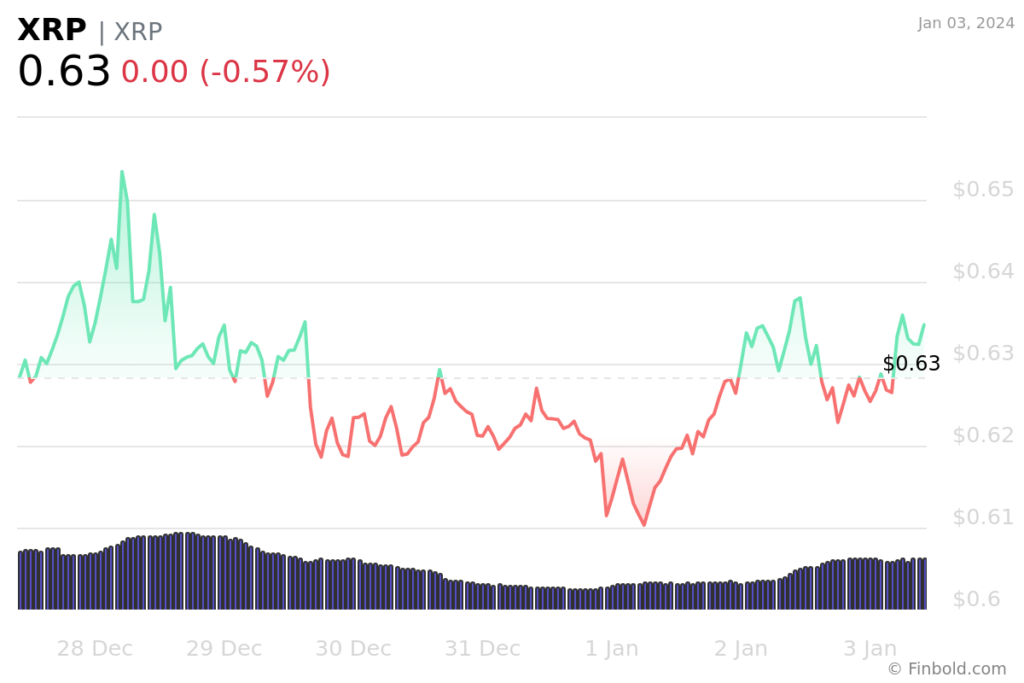
The XRP token is trading at $0.635630, reflecting a slight decline of -0.57% in the last 24 hours. However, it maintains a positive trend with a gain of 1.57% over the previous week. There is a marginal decrease of -0.63% in the last month, as indicated by the latest charts on January 3.
Solana (SOL)
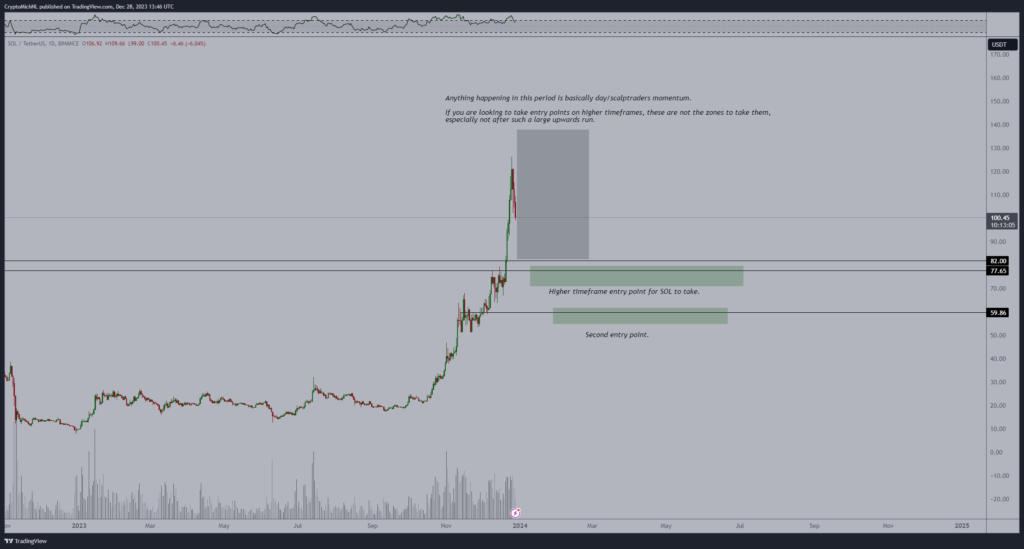
Significant attention is directed towards establishing Solana (SOL) long-term entries in the $70-80 range in higher timeframe trading, as emphasized in a post by cryptocurrency expert Michaël van de Poppe on December 28.
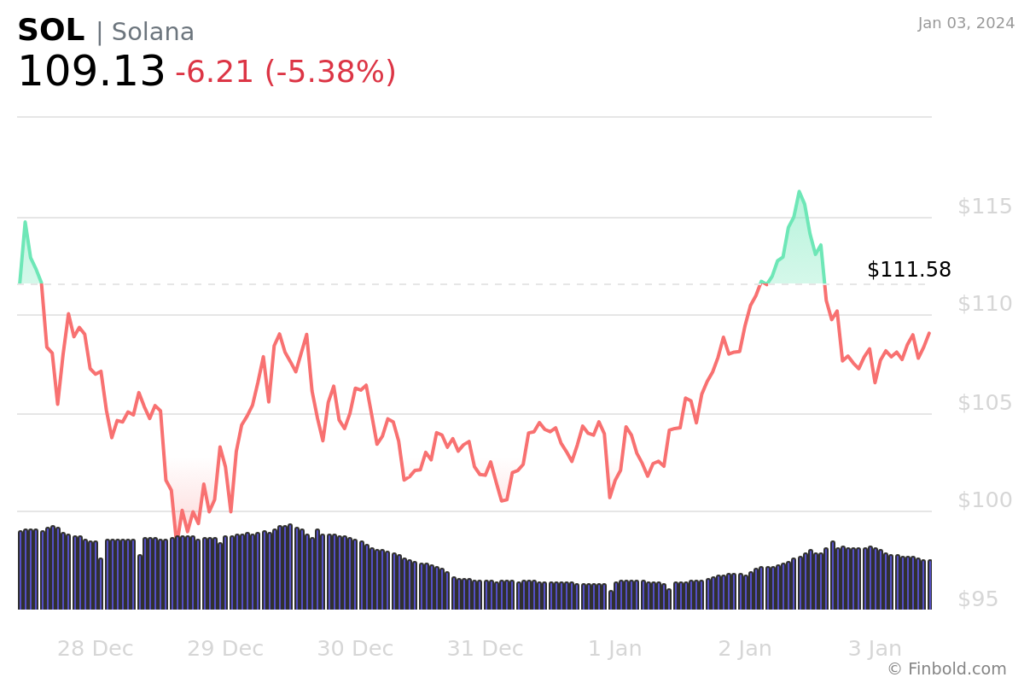
At the time of press, Solana was trading at $109.12, decreasing by -5.40% in the past 24 hours and further by -2.20% in the past week, contrary to impressive gains of 71.36% in the past 30 days.
Cardano (ADA)
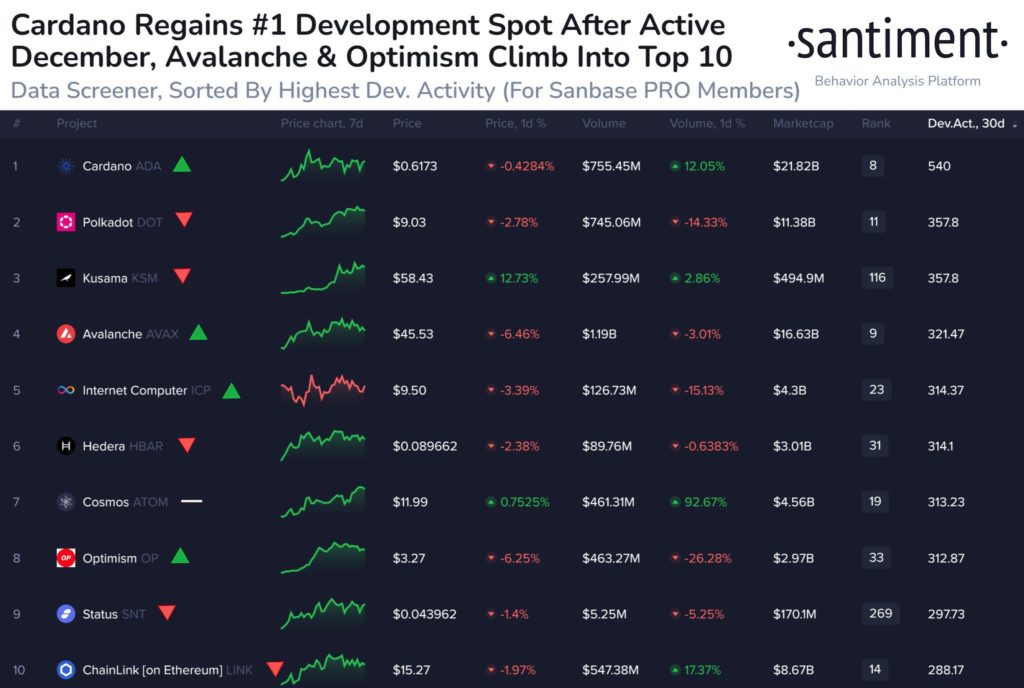
Cardano (ADA) has regained its leading position among all cryptocurrency projects due to significant monthly development activities on the GitHub platform. These activities indicate heightened efforts to expand the associated ecosystem, as per a post from Santiment on December 26.
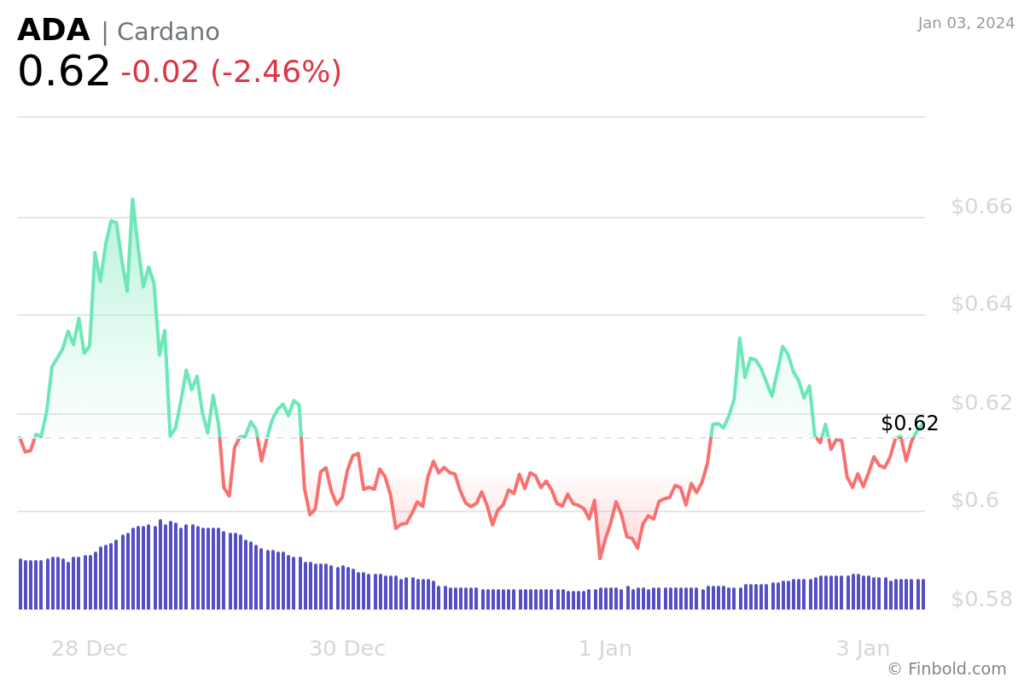
At the time of writing, ADA was trading at $0.617642, marking a decrease of -2.46% in the past 24 hours, contrary to the increase of 1.79% in the previous week and gains of 50.66% in the last 30 days.
Dogecoin (DOGE)
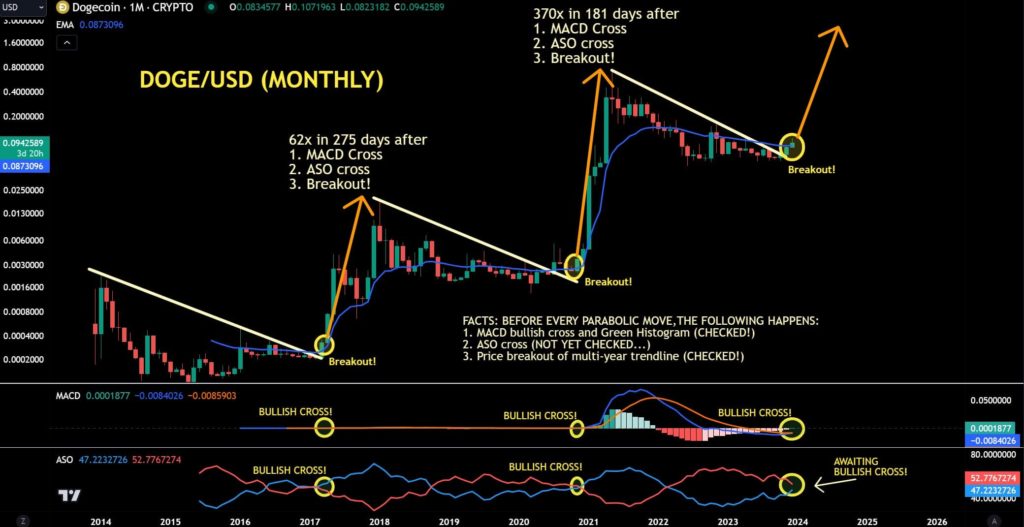
The upcoming months for Dogecoin (DOGE) are currently under consideration. Despite its categorization as a memecoin, the chart structure is notably promising. Before each anticipated upward movement, specific technical indicators are being monitored.
Firstly, a MACD bullish cross has been confirmed. Secondly, the ASO cross is still pending, while there has been a confirmed price breakout of a multi-year trendline, further contributing to the analysis from Jay Dee’s post on December 28.
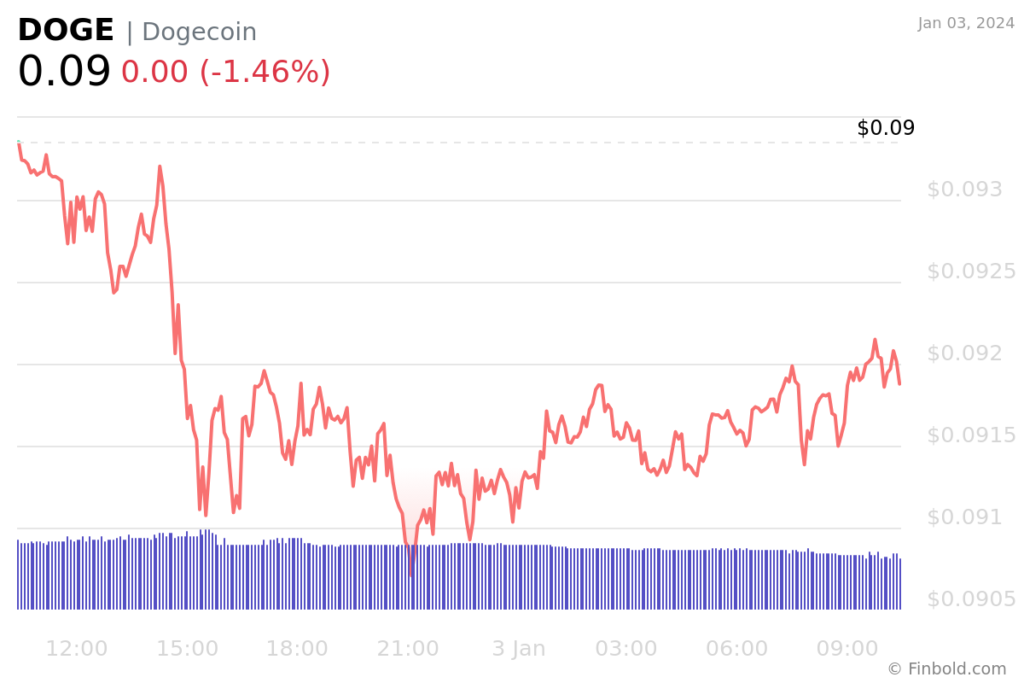
Meanwhile, DOGE is trading at the price of $0.091952, which suggests a decrease of -1.56% on the day and a -0.24% drop loss across the previous week. Nonetheless, it also sustains a 2.62% gain over the past month.
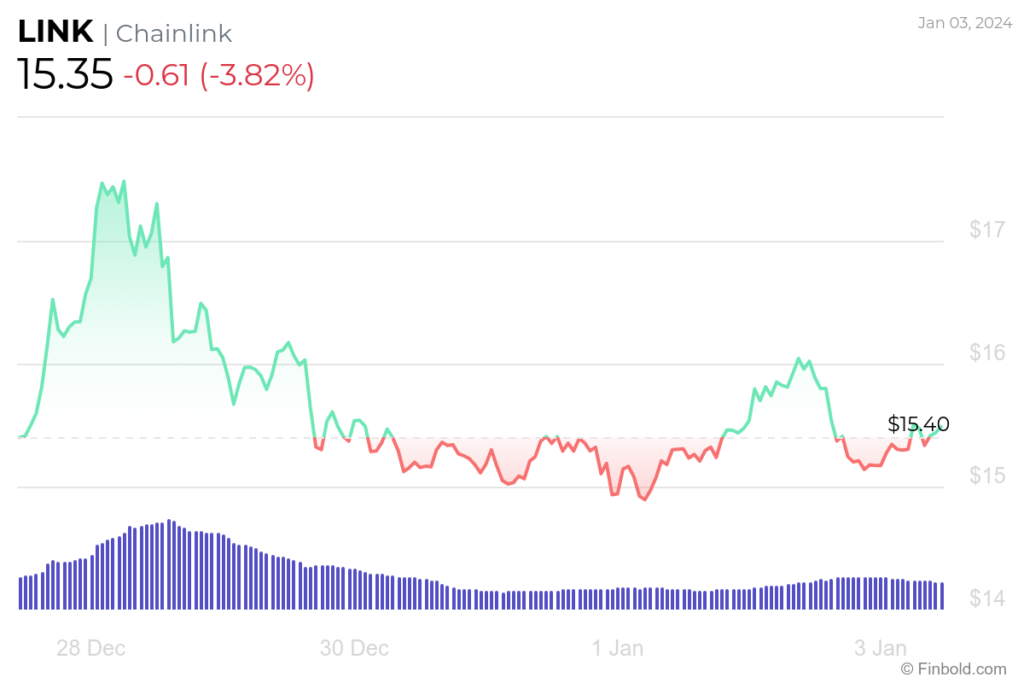
Chainlink (LINK)
Chainlink (LINK) exhibits indications of a bull pennant formation. A conclusive closing above $17.2 may serve as the triggering factor for a potential breakout, driving the price of LINK toward $34. Nevertheless, monitoring the $14.2 level closely is crucial, as a decline below this threshold could undermine the existing bullish outlook, as per Ali Martinez’s post on January 1.
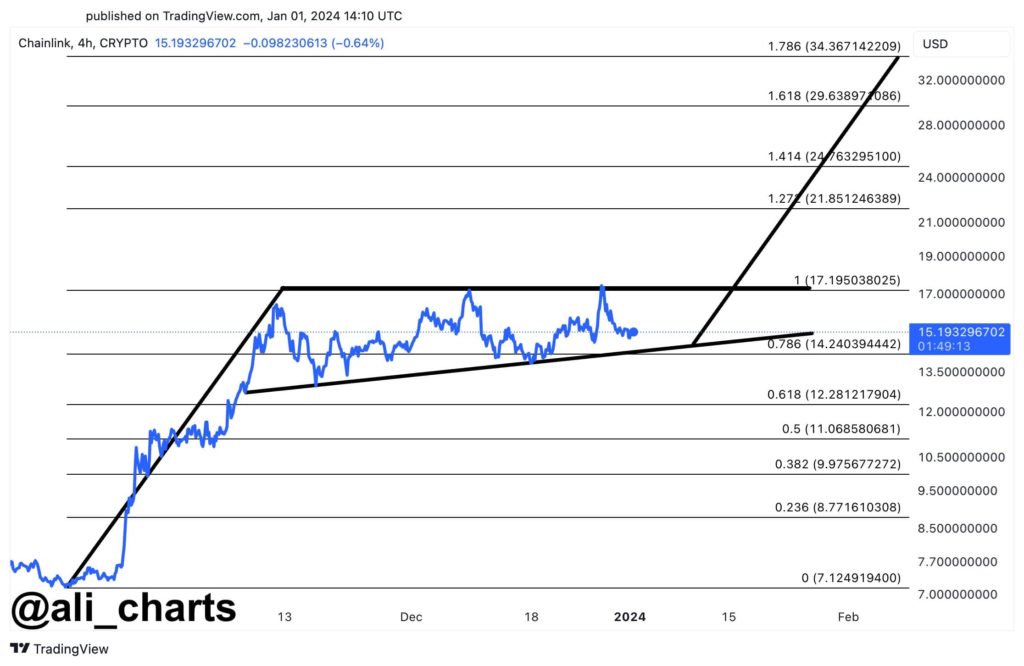
At press time, Chainlink was trading at $15.44, recording a decrease of -3.44% in the last 24 hours. Furthermore, it was also still holding onto the 1.43% increase across the previous seven days and a decrease of -4.04% in the past month.
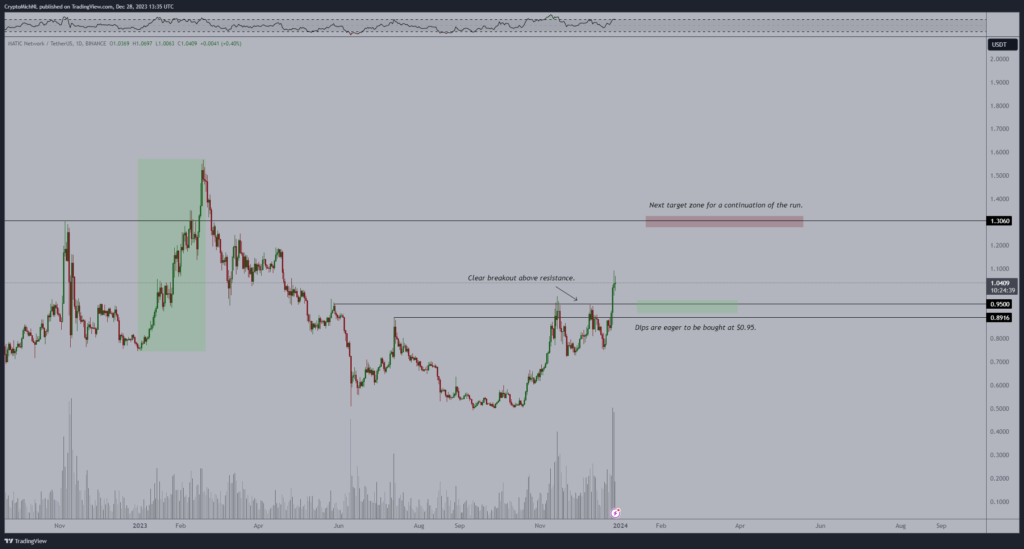
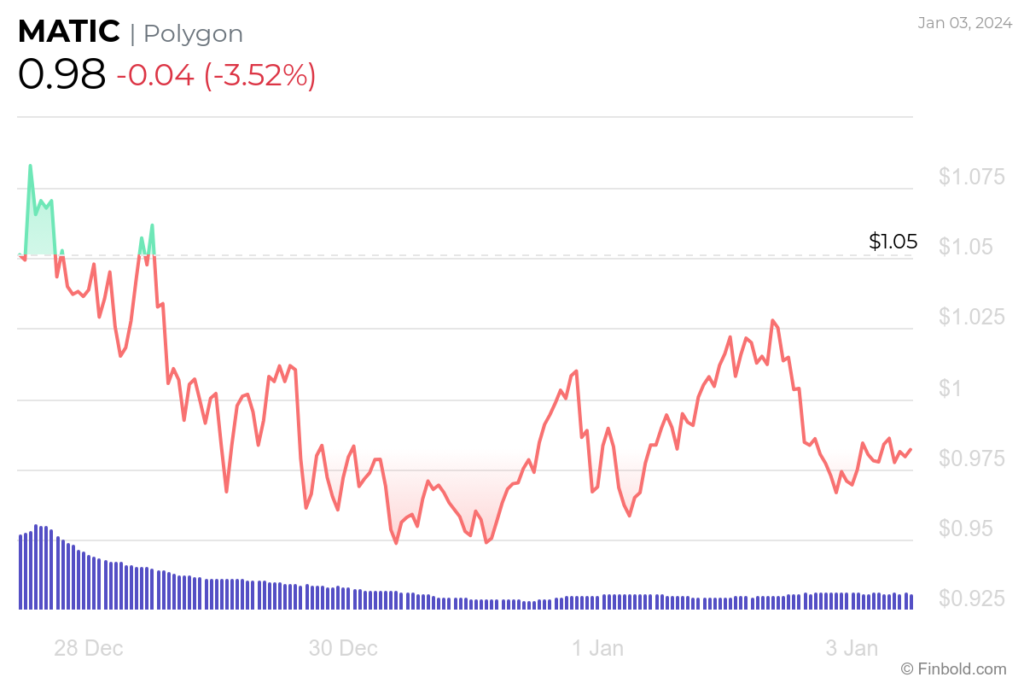
Polygon (MATIC)
Polygon (MATIC) has recently explored the $1+ range, and this temporary position may not persist for an extended duration. Given the emerging momentum, a continuation towards $1.30 is likely, per Michaël van de Poppe.
At the time of publication, MATIC was trading at $0.977847, marking a decrease of -3.52% in the previous 24 hours, as well as losing -8.29% of its value in the past month, while retaining the gains of 18.30% on the monthly chart.
In summary, these seven altcoins may present a favorable investment opportunity as of January 2024, contingent upon maintaining their robust foundations. Nevertheless, investors must conduct independent research and carefully assess individual risk tolerance before investing in these assets.
Disclaimer: The content on this site should not be considered investment advice. Investing is speculative. When investing, your capital is at risk.