In the familiar narrative of recent years, Apple (NASDAQ: AAPL) stock continued its impressive streak with another robust performance throughout 2023.
Boasting a year-to-date gain exceeding 50%, AAPL outpaced the broader market, buoyed by the flourishing artificial intelligence (AI) sector and improving macroeconomic conditions, fostering heightened investor enthusiasm.
However, as the calendar turned to 2024, the tech giant witnessed a sharp pullback, erasing over $200 billion in market capitalization within less than two trading days, according to data retrieved on January 3.
What caused Apple’s downturn?
The primary catalyst behind Apple’s latest setback is a stock downgrade by a prominent Wall Street firm.
Notably, Barclays analysts led by Tim Long demoted AAPL stock to Underweight (Sell) on Tuesday, from Equal Weight (Neutral). In addition, the analyst slashed the 12-month price target to $160 from $161, implying a downside risk of more than 16% from the December 29 closing price.
According to the expert, Apple’s shares overperformed in 2023 while the company posted four consecutive quarters of sales declines.
Among the primary concerns noted by Long were “lackluster” sales of Apple’s iPhone 15, its single-biggest revenue driver. Moreover, the upcoming 16 faces a similarly gloomy outlook, the analyst wrote.
“We expect reversion after a year when most quarters were missed and the stock outperformed.”
– Long said.
Long and his team of analysts also expect weak demand for Apple’s other hardware offerings, while revenue growth in its lucrative services unit is not anticipated to exceed 10% this year.
AAPL stock analysis
At press time, shares of Apple were down roughly 1% at $183.76, the lowest since mid-November.
Since December 29, the last trading day of 2023, the stock fell more than 4.5%, erasing over $200 billion off its market capitalization.
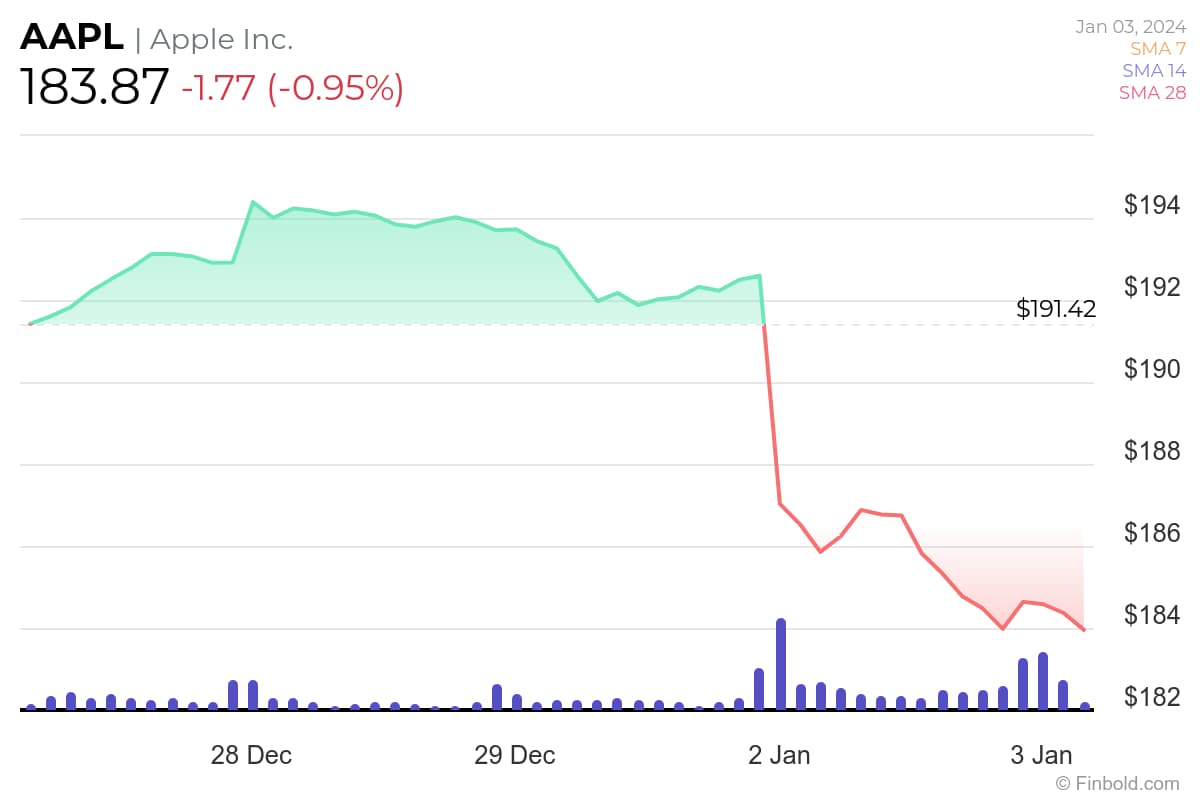
At the current level, AAPL stock is trading above a crucial confluence support zone formed by 100-day and 200-day moving averages (MAs) at $182.31 and $179.78, respectively. Losing this area would pave the way for Apple to fall toward the next support area between $173.5 and $172.
On the upside, the stock faces near-term resistances at $186.6 and $190, indicating areas where selling pressure may increase.
Buy stocks now with Interactive Brokers – the most advanced investment platform
Disclaimer: The content on this site should not be considered investment advice. Investing is speculative. When investing, your capital is at risk.