With the previous week bringing gains for the cryptocurrency market, some digital assets displayed promising signals that might indicate their future movement. Dogecoin (DOGE) is one of those.
The TD Sequential has recently generated a buy signal on the 3-day chart for Dogecoin. The probability of a resurgence to $0.100 or beyond appears favorable, contingent upon the sustained stability of the $0.074 support cluster, per a post on X by crypto analyst Ali Martinez on January 14.
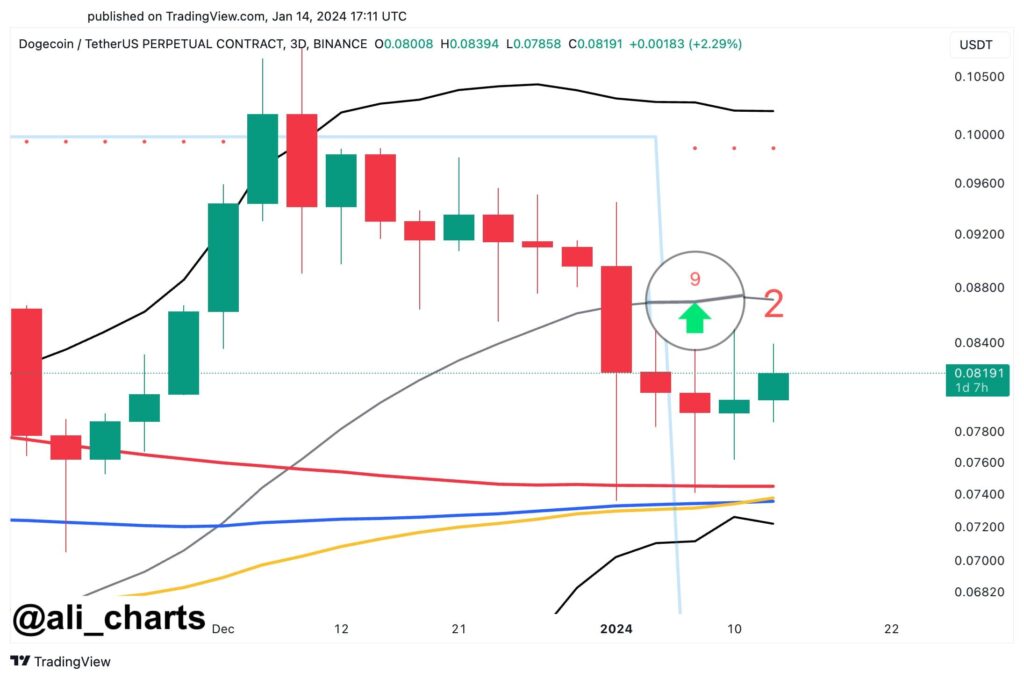
The TD sequential is a robust tool crafted to pinpoint the precise moment of trend fatigue and subsequent price reversal. As a counter-trend instrument, it addresses the limitations observed in various technical analysis indicators that prove profitable in trending markets but exhibit suboptimal performance in sideways or ranging markets.
Another technical indicator is not so optimistic
Many technical indicators should be employed to determine whether a potential surge for DOGE is viable and to be expected soon.
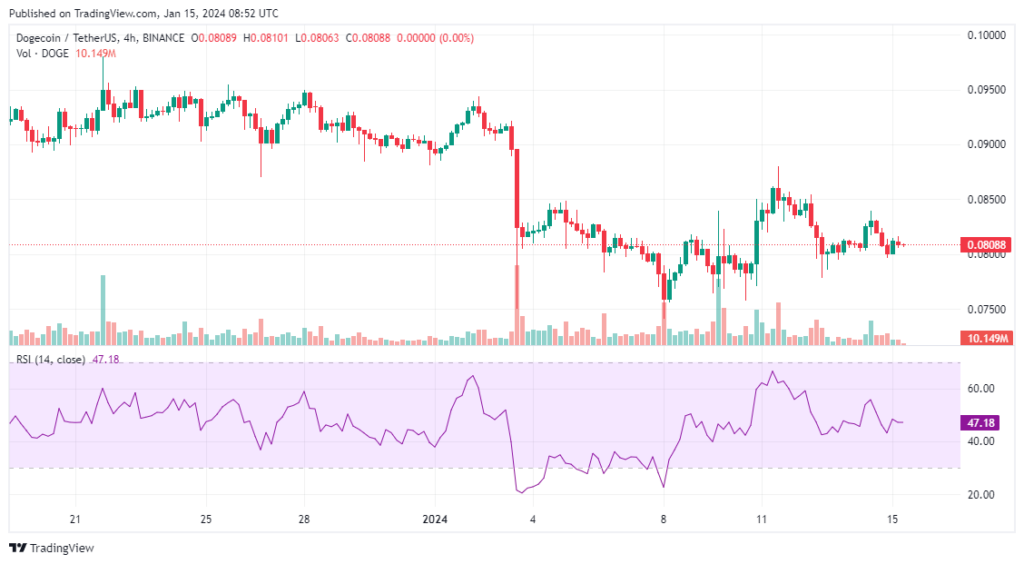
A relative strength index (RSI) is designed to chart the market’s present and past strengths or weaknesses, relying on the closing prices observed over a recent trading period.
Despite the rebound of the Dogecoin price, there are no optimistic indications in the daily relative strength index (RSI). A reading exceeding 50 and an upward trajectory signify a prevailing advantage for bulls, while readings below 50 are bearish. The daily RSI stands at 47 as of the press time.
Dogecoin price analysis
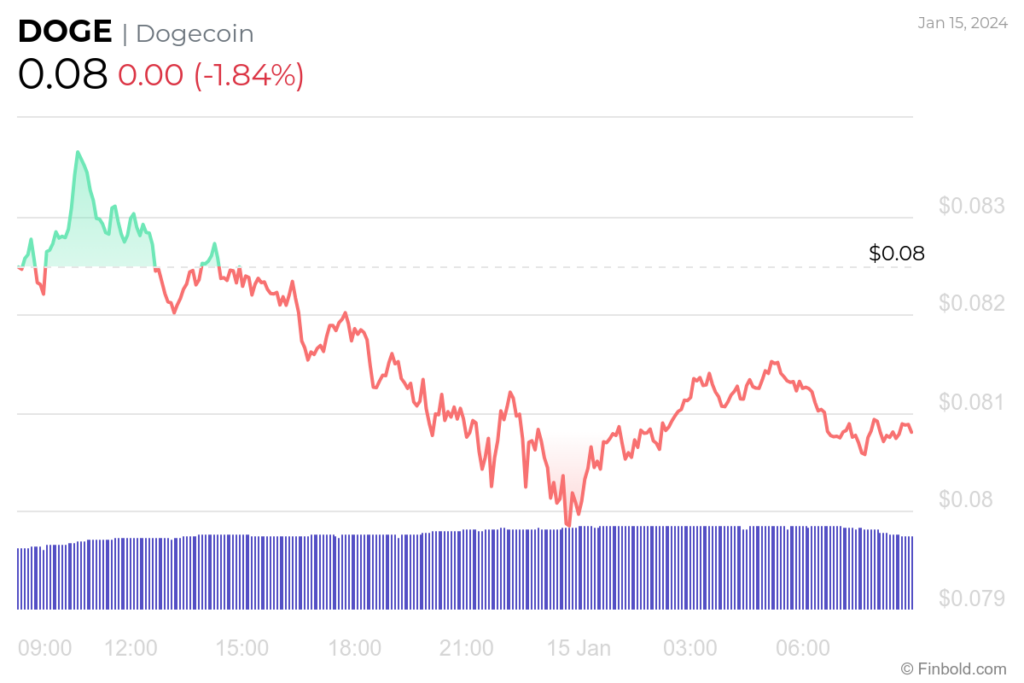
At the time of press, DOGE was trading at $0.0809, marking a daily decrease of -1.83%, contrary to the gains of 3.77% on the weekly chart and losing -16.22% in the previous month.
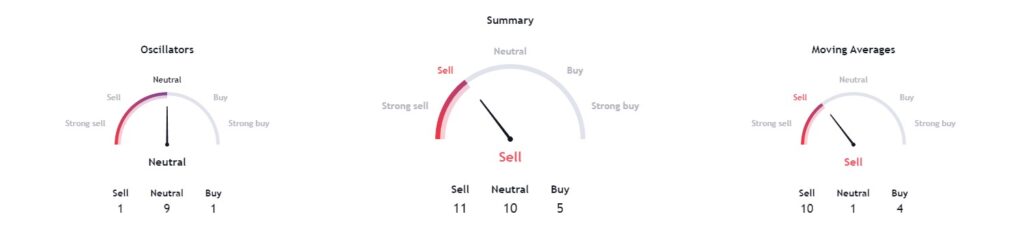
Technical indicators are currently unfavorable for the DOGE price, leaning towards a ‘sell’ signal at 11, with moving averages aligning with a ‘sell’ recommendation at 10. On the other hand, oscillators maintain a neutral stance, registering a value of 9.
When looking at digital asset prices, it is essential to look at as many indicators as possible, as only then will investors be able to see the bigger picture. This helps in preventing unnecessary risks.
Disclaimer: The content on this site should not be considered investment advice. Investing is speculative. When investing, your capital is at risk.