
Amid the ongoing slowdown in the past 24 hours that has seen the majority of crypto assets trading in the red, Cardano (ADA) also seems to be slowing down. Whether this is temporary or the beginning of a bearish cycle remains a question that concerns the investors.
Considering the broader trend and the current disconnection of Cardano from it, Finbold enlisted the assistance of CoinCodex to utilize its AI-powered machine-learning algorithms in evaluating the anticipated price of ADA at the month’s conclusion.
These algorithms assess dynamic market conditions and analyze pertinent indicators to predict the probability of this crypto experiencing gains by the end of the current month.
Picks for you
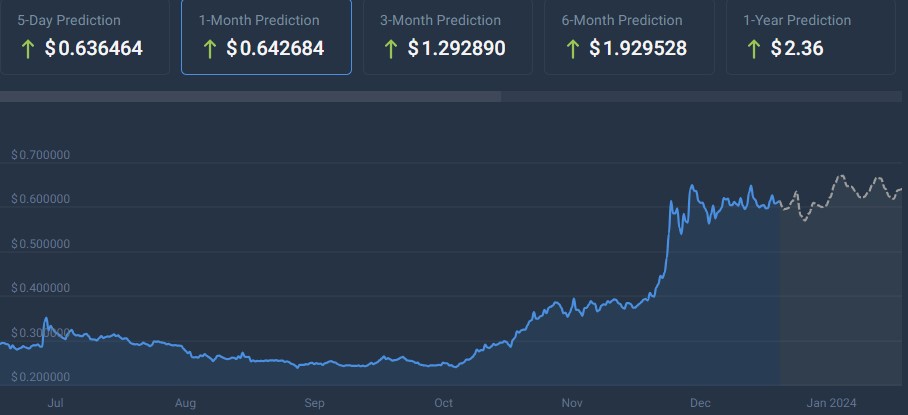
As per the algorithms, ADA is projected to elevate its price to $0.620460 by January 31, indicating a rise of 1.31% from its current level of $0.612433 at the time of this writing.
Analyst predictions
Cardano experienced an increase, rising from $0.57 on December 19 to $0.61 on December 26. The bullish trend in previous months suggested a potential continuation, supported by 26 technical indicators in the green.
This positive momentum might propel Cardano to reach $0.63 in January, with a prospective surge to $11 anticipated in 2024, as per a post on X from crypto analyst Dan Gambardello on December 20.
Cardano faces a crucial resistance zone spanning from $0.60 to $0.67. Two plausible scenarios are envisaged: an upward surge toward the $0.70 range or a potential dip down to $0.40, as per cryptocurrency analyst LuckSide’s YouTube video on January 1.
ADA price analysis
At the time of press, ADA was trading at $0.614620, reflecting a decline of -2.97% in the last 24 hours, in contrast to a positive gain of 1.72% over the preceding week and a notable upside of 48.64% in the past 30 days.
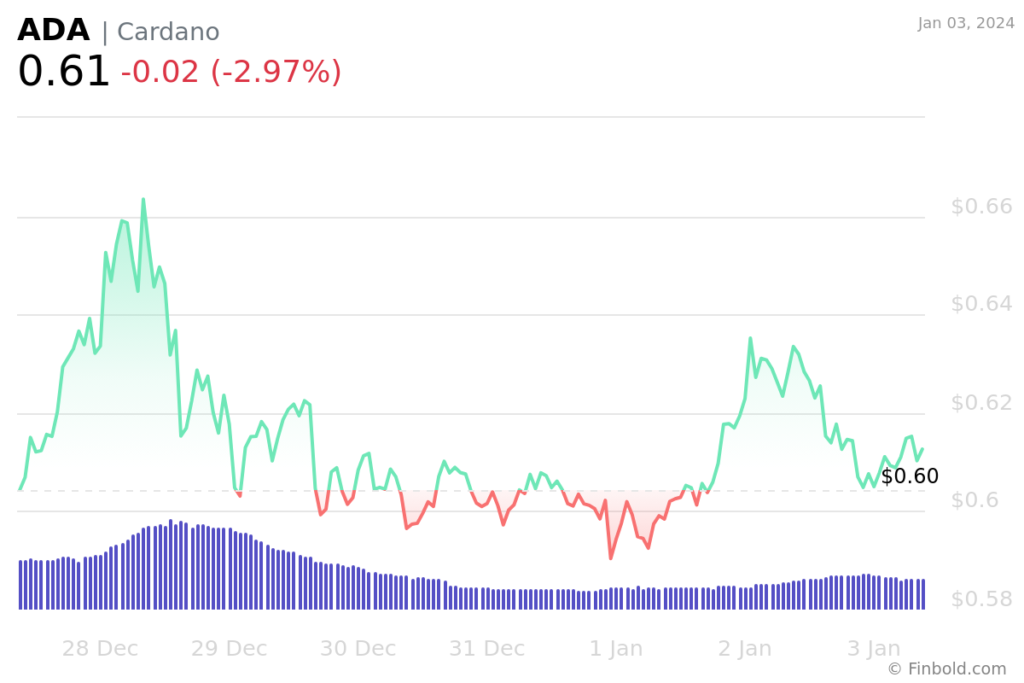
Over the last year, the asset has surged by 143%, outperforming 66% of the top 100 cryptocurrencies. It is currently trading above the 200-day simple moving average. In the past 30 days, there have been 16 green trading days, accounting for 53% of the observed period.
While the current outlook for ADA might be positive, coupled with sound technical indicators, investors need to conduct their research, which will help them minimize the risks when allocating funds.
Disclaimer: The content on this site should not be considered investment advice. Investing is speculative. When investing, your capital is at risk.