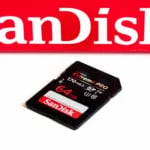
In September 2023, Costco (NASDAQ: COST) started selling gold bars, which was a great hit, as over $100 million worth has been sold, according to reports.
Amidst the global economic uncertainty witnessed in recent years and the increasing demand for precious metals as a commodity, Costco responded by introducing 1oz (28g) bars of 24-karat gold for sale exclusively on their online platform in September. Eligible Costco members were allowed to purchase up to two bars each.
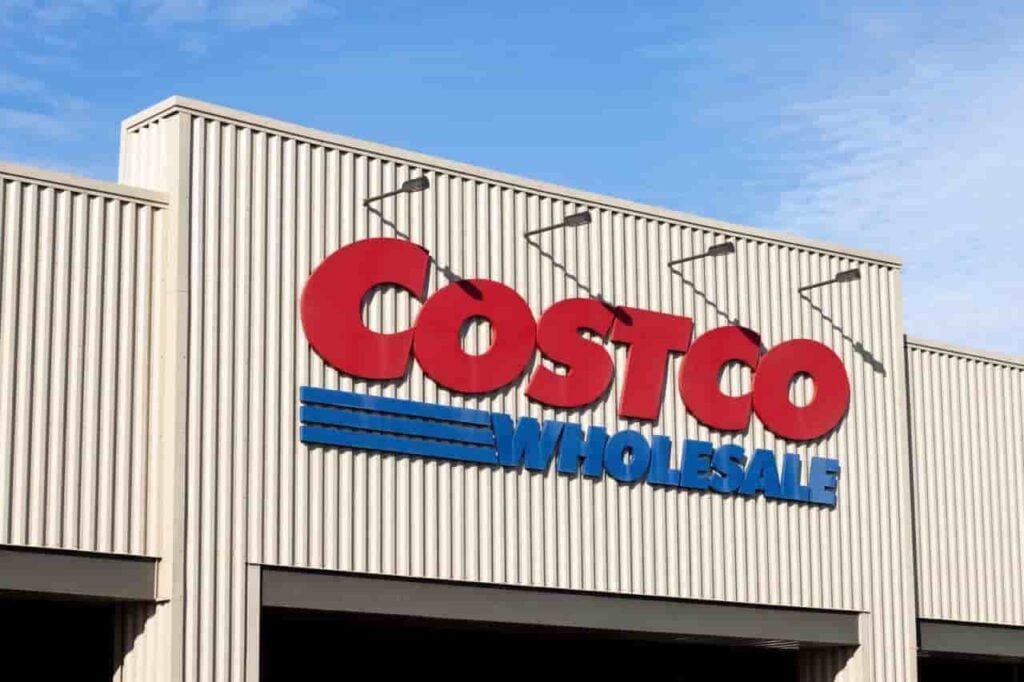
But there is a reason why this might be a bad investment, and traders could be way better off if they invested their resources in COST stock instead.
Why is gold a bad investment compared to COST stock?
The first and most important reason is that traders are not getting a fair price for gold when they buy it at Costco. In mid-December, gold ingots were priced about 3% higher than the fair market value of gold, which had previously reached a peak of 7.3% higher late last year. One can anticipate a comparable discount or potentially even a higher rate when selling gold.
The second reason is that the returns on gold investments are marginally small and should be only used to counter inflation and save the value invested.
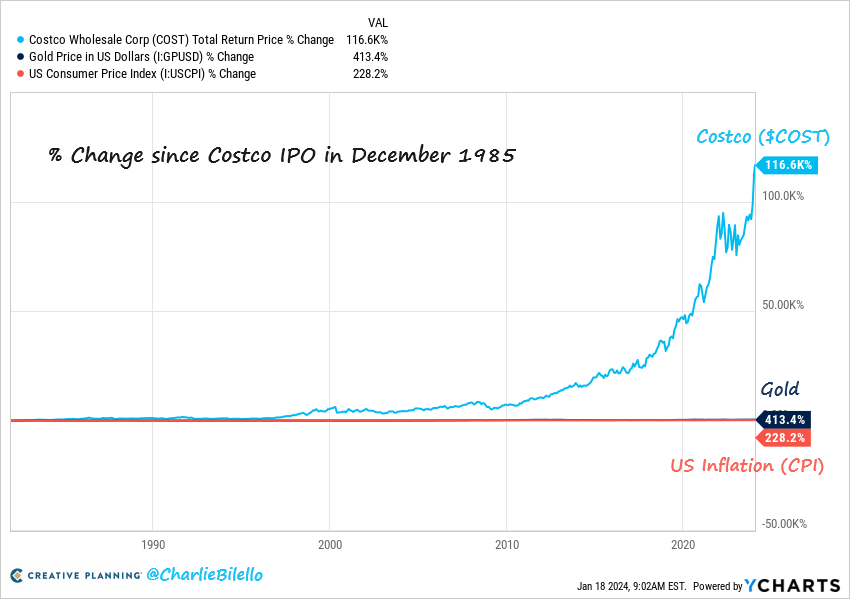
Ironically, historical analysis indicates investors would have realized considerably superior returns by opting for Costco stock. Since the company’s initial public offering (IPO) in 1985, Costco stock has grown remarkably, boasting an impressive surge of +116,600%.
In contrast, the appreciation of gold stands at +413%, while inflation has registered a comparatively modest increase of +228%. This historical performance underscores the potential advantages of investing in Costco stock instead of traditional gold holdings, per a post on X from stock analyst Charlie Bilello on January 24.
COST stock price analysis
At the time of press, COST stock was trading at $687.59, experiencing a decrease of -0.71% since the previous closure, contrary to gains of 1.22% over the last five trading sessions.
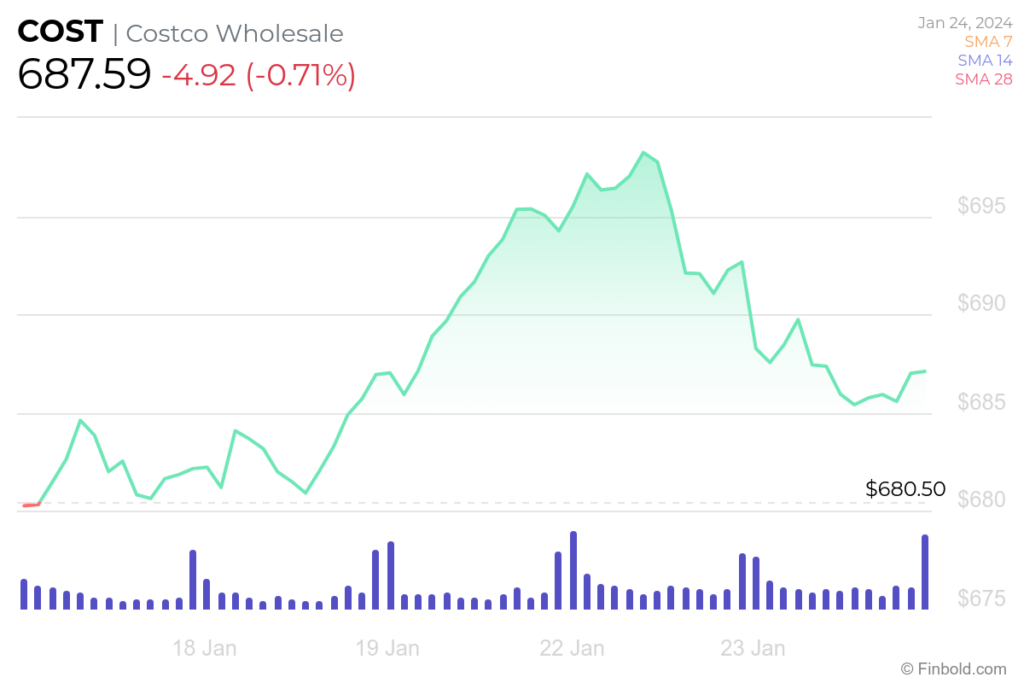
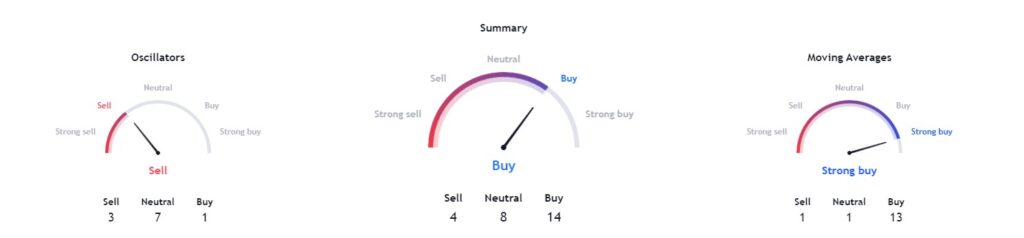
Technical indicators have an overall rating of ‘buy’ at 14. Moving averages tilt towards ‘strong buy’ at 13. On the contrary, oscillators indicate a ‘sell’ at 3.
Those investors who opted to allocate resources to gold instead of COST stock might regret their decision. COST stock proved to be a real performer since its IPO almost four decades ago.
Buy stocks now with Interactive Brokers – the most advanced investment platform
Disclaimer: The content on this site should not be considered investment advice. Investing is speculative. When investing, your capital is at risk.