As the price of XRP consolidates in a tight range, the token’s past price rallies could offer hints about the next trajectory.
Notably, cryptocurrency analyst Dark Defender shared this observation in an X post on August 2, comparing XRP’s massive 2017 bull run to its current chart patterns.
The analysis noted that XRP’s recent price has been confined to a narrow range between $0.3917 and $0.6649, which has consolidated for an extended period. In this context, Dark Defender suggested that the $0.6649 level above the weekly Ichimoku cloud is crucial to watch, as it could open the door to higher potential targets.
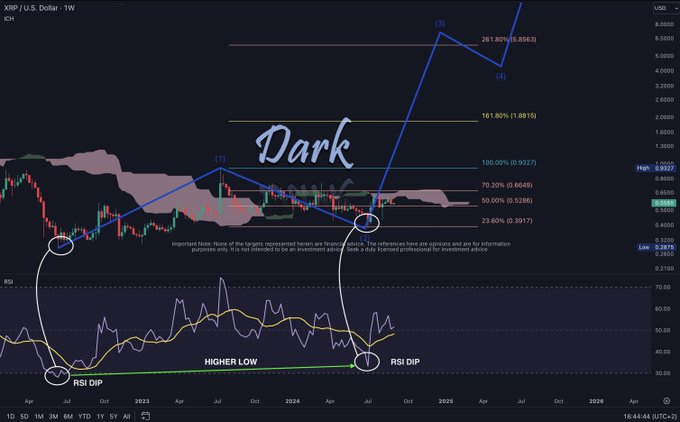
The expert also highlighted the significance of the weekly Relative Strength Index (RSI), which shows dips that align with price declines. Notably, a “golden cross” has recently formed in the RSI indicator—a bullish signal for more upward movement.
Based on these technical indicators, the expert noted that investors should anticipate a possible massive breakout if XRP can sustain its price above $0.6649.
In this regard, the price analysis suggested a resemblance between the current XRP price movement and the conditions surrounding the 2017 bull run, with the analyst likening it to a ‘déjà vu’ situation.
XRP’s potential breakout
According to Dark Defender, if a similar price movement occurs, the Fibonacci extension level at approximately $18.22 could serve as the upper target for Wave 3, representing a potential increase of over 3,000% from current levels.
“We are having a deja vu of 2017 by standing weeks in front of the XRP Bull Run. If a similar run is in place, $18.22, (NFA) the Fibonacci level of 361.80%, is expected to be the upper target level of Wave 3,” the expert noted.
To put this surge into perspective, if XRP were to trade at $18, it would reflect a potential market cap slightly above $1 trillion, making the token the second most valuable cryptocurrency behind Bitcoin (BTC), provided other assets experience minimal trading activity during the period.
The analysis illustrated this price projection using the Ichimoku cloud, a technical analysis tool that shows support and resistance levels. Based on this analysis, XRP is trading near its upper boundary.
Additionally, the waves in Elliott Wave Theory suggest a possible multi-wave rally in the offing, where Wave 3 could break out. Indeed, before reaching the third wave target of $18.22, investors should anticipate a possible second wave at the $9.58 mark.
It’s worth noting that the projection is ambitious, and XRP will need to overcome several barriers while relying on the general market trajectory to rally. For instance, the ongoing legal case between Ripple and the Securities Exchange Commission (SEC) will likely play a crucial role, considering XRP is in limbo amid concerns regarding a possible appeal by the regulator.
XRP targetting new highs
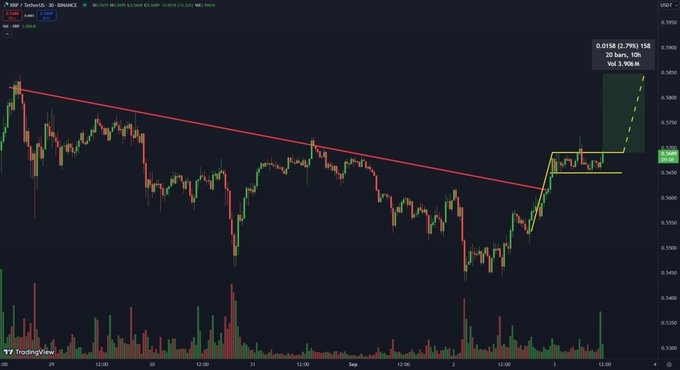
Meanwhile, following XRP’s short-term bullishness, another crypto analyst, known by the pseudonym The Moon, pointed out that the digital asset will likely see gains soon.
Specifically, in an X post on September 3, the analyst noted that XRP has broken through a descending resistance line, signaling a potential upward movement. This break above the resistance suggests a possible trend reversal, with the next target potentially set at $0.5850.
XRP price analysis
As of press time, XRP was trading at $0.56, reflecting a 24-hour gain of about 1.7%. However, over the past seven days, the token has dropped by more than 4%.
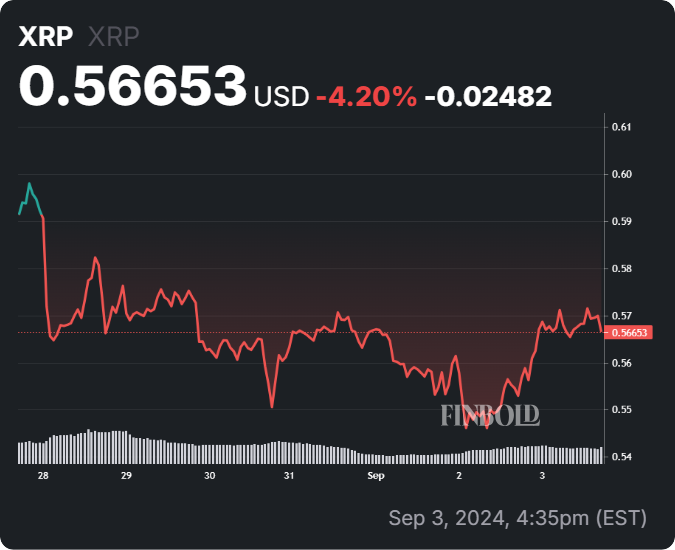
Overall, in the short term, XRP shows bullish tendencies, further backed by technical indicators. Currently, the token valuation is above the 200-day simple moving average (SMA), which sits at $0.5463. Indeed, the mark suggests that XRP could be staring at general long-term bullish sentiment.
Disclaimer: The content on this site should not be considered investment advice. Investing is speculative. When investing, your capital is at risk.