
The following guide will examine the golden cross pattern, how to understand the pattern on charts and use it as part of your trading strategy, as well as analyze the pros and cons of using this technical analysis tool.
Best Crypto Exchange for Intermediate Traders and Investors
-
Invest in cryptocurrencies and 3,000+ other assets including stocks and precious metals.
-
0% commission on stocks - buy in bulk or just a fraction from as little as $10. Other fees apply. For more information, visit etoro.com/trading/fees.
-
Copy top-performing traders in real time, automatically.
-
eToro USA is registered with FINRA for securities trading.
What is a golden cross in stocks?
The opposite of a golden cross pattern is a death cross, in which a shorter-term moving average crosses below a longer-term moving average and is typically considered a bearish signal.
Beginner’s corner:
- What is Investing? Putting Money to Work
- 17 Common Investing Mistakes to Avoid
- 15 Top-Rated Investment Books of All Time
- How to Buy Stocks? Complete Beginner’s Guide
- 10 Best Stock Trading Books for Beginners
- 15 Highest-Rated Crypto Books for Beginners
- 6 Basic Rules of Investing
- Dividend Investing for Beginners
- Top 6 Real Estate Investing Books for Beginners
The golden cross pattern explained
The occurrence of a golden cross pattern involves three phases:
- A downtrend (the shorter-term MA is below the longer-term MA) is bottoming out;
- The shorter moving average moves above the longer moving average to trigger the emergence of an uptrend;
- The start of a continuing uptrend in which the shorter-term MA stays above the longer-term MA, usually leading to higher prices.
While no two golden crosses are identical, these three stages are usually the characteristic events that signify this particular chart pattern.
Both simple moving average (SMA) pairs and exponential moving average (EMA) pairs can be used to signal a golden cross. The most widely utilized moving averages are the 50-period and the 200-period moving average. Yet, day traders may find smaller periods, such as the 5-period and 15-period moving averages, more helpful in trading intraday golden cross breakouts.
Traders can adjust the time interval of the charts to reflect the previous hours, days, weeks, etc. Generally, larger chart time frames tend to form more powerful, lasting breakouts.
For instance, the daily 50-day MA cross above 200-day MA on a stock market index such as the S&P 500 is one of the most widespread bullish market indications. Additionally, a golden cross pattern can be a crucial bellwether indicator, in which a company or stock marks a turning point or an upcoming trend in the market as a whole.
Golden cross example
As noted above, a monthly 50-period and 200-period MA golden cross, for example, is significantly more reliable and longer-lasting than the same moving average crossover on a 15-minute chart. As such, a golden cross on a longer time frame will probably have a more powerful impact on the market than on the hourly chart.
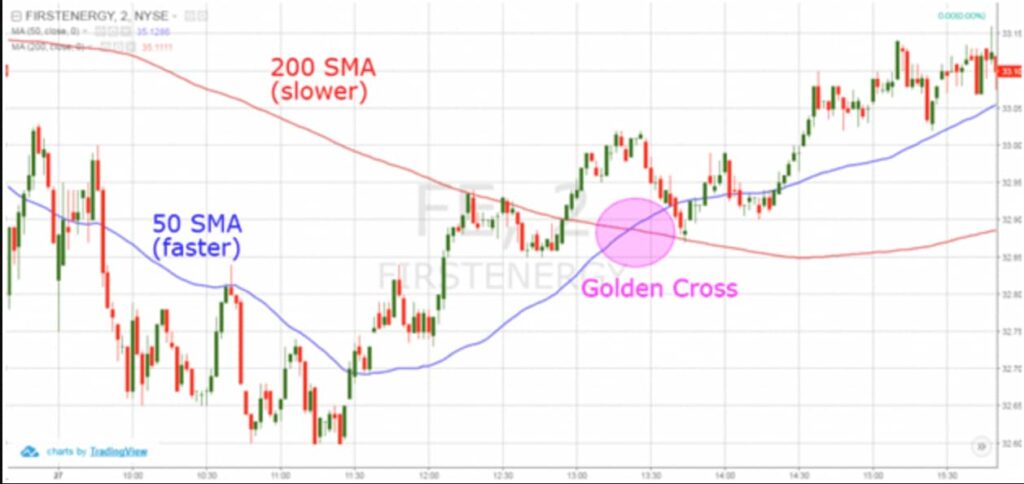
The first stage presents a stagnating downtrend as strong buying interest overwhelms selling interest.
Then, in the second stage, a leveling out occurs on the chart, with buyers pushing prices higher as they try to gain control. The resulting momentum gradually moves the 50-day MA through the 200-MA, at which point they cross.
Once the crossover happens, the longer-term moving average is typically considered a strong support (price decline has halted) area. Some traders may wait or use other technical indicators to confirm a trend reversal before entering the market.
The last stage occurs as the 50-day MA continues to climb, confirming the bull market, also typically leading to overbuying, albeit only in short bursts. During this phase, the longer moving average should act as a support level when corrective downside pullbacks occur. So, as long as both price and the 50-day average remain above the 200-day average, the bull market remains intact.
Golden cross vs. death cross
The golden cross and the death cross are the exact opposites in terms of how they present on a chart and what they signal. The main difference between the golden cross vs. death cross is that while the former indicates an uptrend, the latter signals a downtrend.
The golden cross happens when a short-term MA crosses over a long-term MA to the upside and is interpreted as signaling an upward turn in a market.
In contrast, the death cross occurs when a short-term MA crosses under a long-term MA to the downside, indicating a bear market going forward. Both crossovers are considered more powerful when partnered with high trading volume.
In the case of a golden cross, the long-term MA is observed to be a significant support level, whereas, in a death cross, it’s seen as a resistance level for the market after the crossover has occurred.
Recommended video: What is a golden cross and how do you use it?
Best Crypto Exchange for Intermediate Traders and Investors
-
Invest in cryptocurrencies and 3,000+ other assets including stocks and precious metals.
-
0% commission on stocks - buy in bulk or just a fraction from as little as $10. Other fees apply. For more information, visit etoro.com/trading/fees.
-
Copy top-performing traders in real time, automatically.
-
eToro USA is registered with FINRA for securities trading.
Golden cross trading strategies
The golden cross pattern can help determine good times to enter a long position or exit a short position, as it indicates the end of a bear market. There are various ways to utilize golden cross trading strategies. Below we examine three of them:
- EMA crosses over SMA;
- A golden cross plus a double bottom pattern;
- Entry in pullbacks.
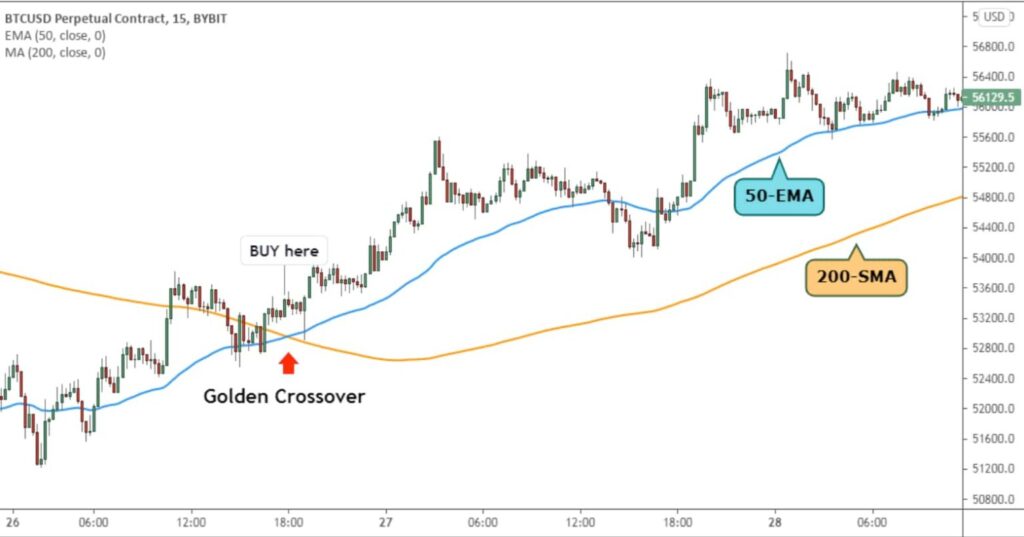
1. EMA crosses above SMA
The most effective moving average values in a golden cross are the 50 EMA and 200 SMA. While the SMA gives equal weight to each value within a period, the SMA places greater weight on recent prices. Therefore, EMA with a short-term value and SMA with a long-term value can deliver the most accurate price direction.
Identifying the 50 EMA and 200 SMA crossovers is simple. The hourly chart in the image below shows strong upward price movement as soon as the 50 EMA moves above the 200 SMA, indicating bullish conditions.
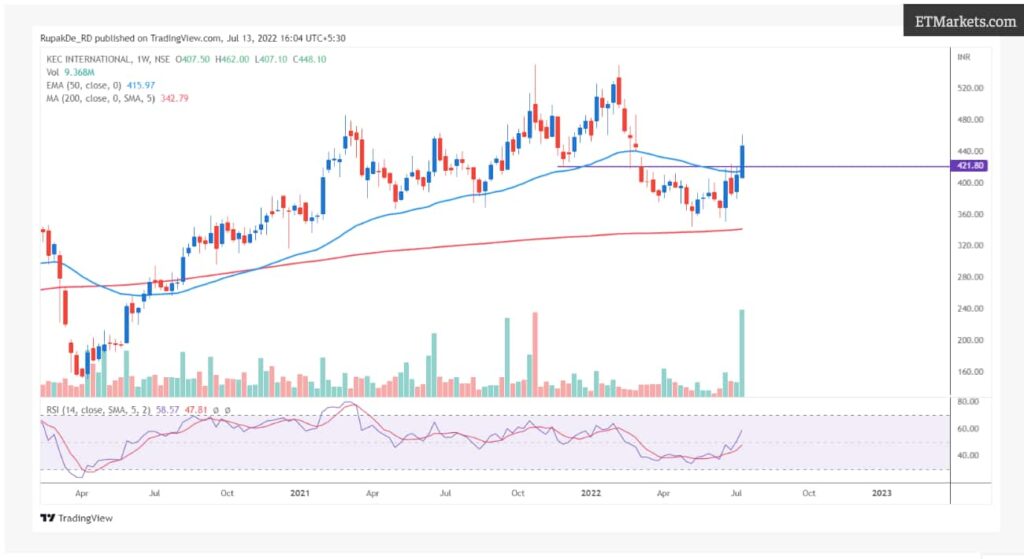
2. A golden cross plus a double bottom pattern
This next strategy combines the golden cross with the double bottom pattern.
The double bottom pattern represents a change in trend and a momentum reversal from previous price action. It is an area where the price makes two equal lows (to the support level, i.e., long-term MA), resembling the letter “W” on a chart.
The pattern usually follows a major or minor downtrend, signaling a reversal and the beginning of a potential uptrend. It indicates that sellers tried to decrease the price, after which bulls became active to pump the price higher again.
The double bottom, like most chart patterns, is best suited for analyzing a market’s intermediate- to longer-term view to receive successful trading signals. Therefore, traders may find daily, weekly, or monthly data price charts for this particular pattern more useful.
The chart below shows the end of a downward market as the 50 EMA moves above the 200 SMA. We then witness a double bottom confirming the upward movement. Remember, the price should fall below the 50 EMA but stay above the 200 SMA (the support level).
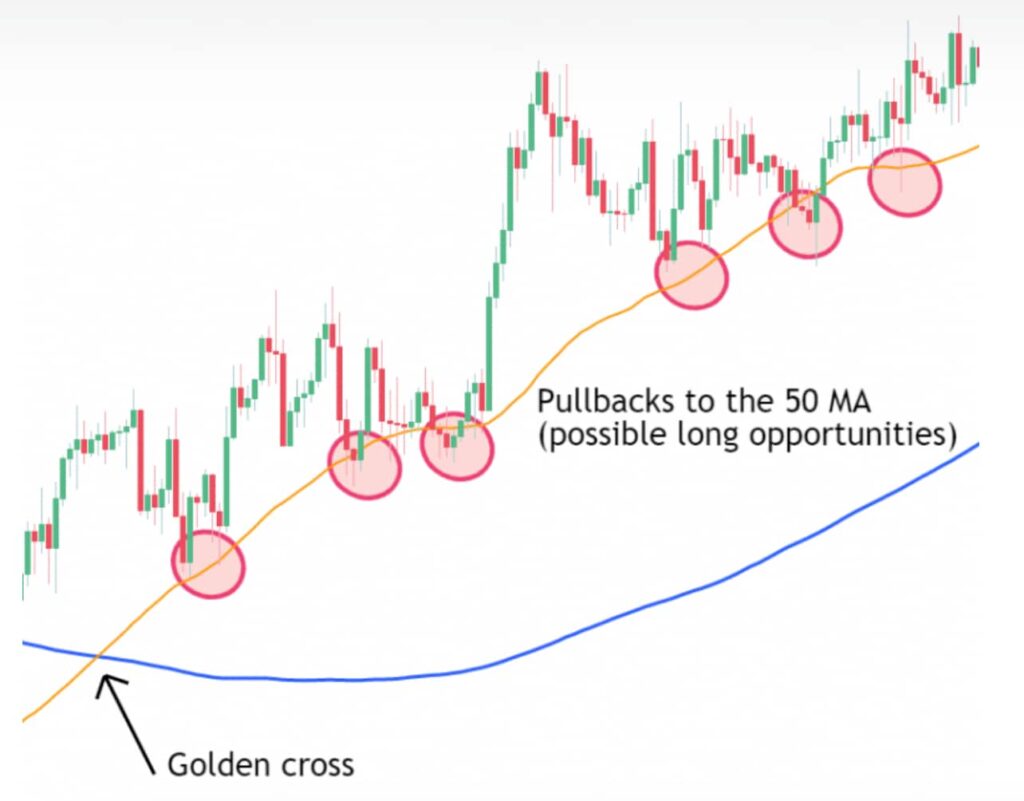
3. Entry in pullbacks
Price always moves in waves, and golden cross signals often appear at the tops of those waves. To catch the next upward leg right from the beginning, traders should aim for pullback points, i.e., when the price pulls back to the short-term MA.
Pros and cons of using the golden cross pattern

Pros
- Can confirm a trend reversal;
- Applicable to any market and timeframe;
- Helps to detect potential entry points;
- Relatively easy to evaluate and gather information;
- Valuable as a standalone chart pattern or in conjunction with other technical indicators.

Cons
- The golden cross is based on moving averages which are lagging indicators, providing delayed feedback to the trader;
- It can produce a false signal;
- The pattern should always be confirmed with additional technical signals and indicators before trading;
- The most accurate signals are delivered only in high trading volumes and with longer timeframes;
- It is not great at predicting a trend reversal rather than confirming one already underway.
In conclusion
Golden crosses are powerful trading signals defined by the short-term moving average crossing above a long-term moving average, telling investors that momentum is changing to the upside. As a bullish signal, this particular trading pattern can help determine a possible entry point.
However, because the golden cross can generate false signals and is not entirely helpful at predicting trend reversals, it should always be used with additional technical analysis tools rather than as a standalone source of trading information.
Disclaimer: The content on this site should not be considered investment advice. Investing is speculative. When investing, your capital is at risk.
FAQs about the golden cross
What is a golden cross in stocks?
A golden cross is a chart pattern used in technical analysis in which a short-term moving average crosses above a long-term moving average, suggesting a potential stock market rally.
What time frames give the most accurate golden cross reading?
Generally, larger chart time frames– days, weeks, or months– tend to form more powerful, lasting breakouts.
What are the three phases of a golden cross?
The three phases of a golden cross: A downtrend that is about to reverse because selling interest is being overpowered by buying interest; the emergence of a new uptrend as the shorter-term MA crosses over the longer-term MA to the upside; and a continued uptrend where the shorter-term MA stays above the longer-term MA.
What are the limitations of a golden cross?
As a lagging indicator, the golden cross may provide limited predictive value for traders and be more valuable as confirmation of an uptrend rather than as a trend reversal signal.
How do traders use the golden cross?
Traders can use the golden cross to assist in determining good times to both enter and exit the market (for short-sellers).
What is a death cross?
A death cross is a chart pattern used in technical analysis in which a long-term moving average crosses under a short-term moving average, indicating a bear market going forward.
What's the difference between death cross vs golden cross?
The golden cross and death cross are both technical analysis indicators, but they signal opposite market trends. While the golden cross is seen as a buying signal, the death cross is often interpreted as a signal to sell or a warning of declining prices ahead. Both are used to predict future price movements based on historical data.
Best Crypto Exchange for Intermediate Traders and Investors
-
Invest in cryptocurrencies and 3,000+ other assets including stocks and precious metals.
-
0% commission on stocks - buy in bulk or just a fraction from as little as $10. Other fees apply. For more information, visit etoro.com/trading/fees.
-
Copy top-performing traders in real time, automatically.
-
eToro USA is registered with FINRA for securities trading.