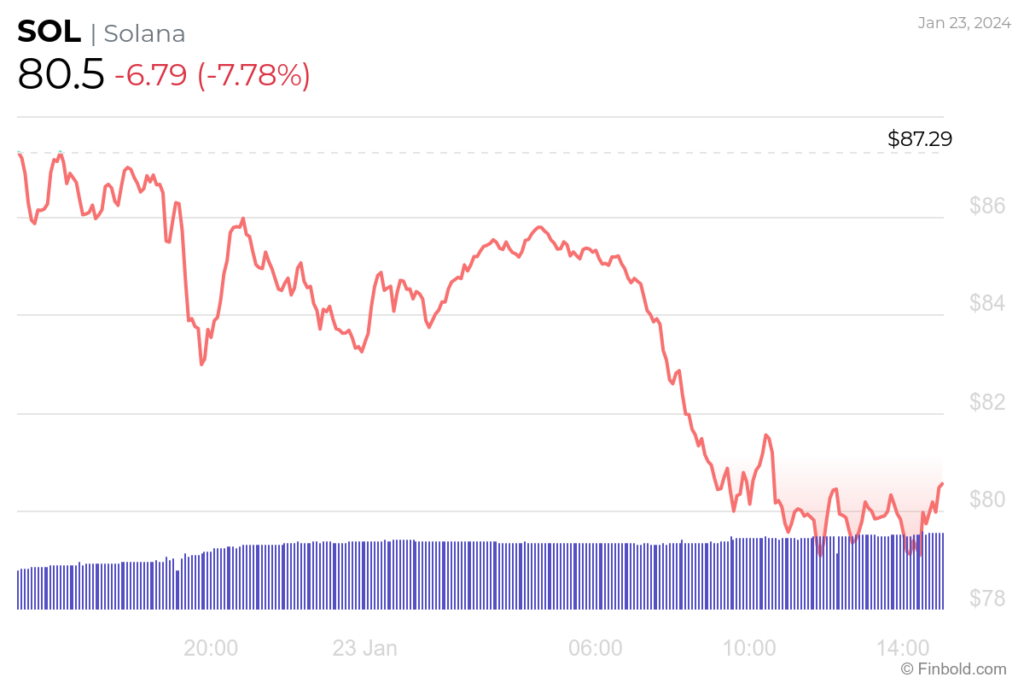
After a strong 2023, which saw Solana (SOL) adding over 200% to its value, this cryptocurrency has hit a rough patch recently, which erased almost 30% of its price. And it seems that the worst is yet to come for SOL.
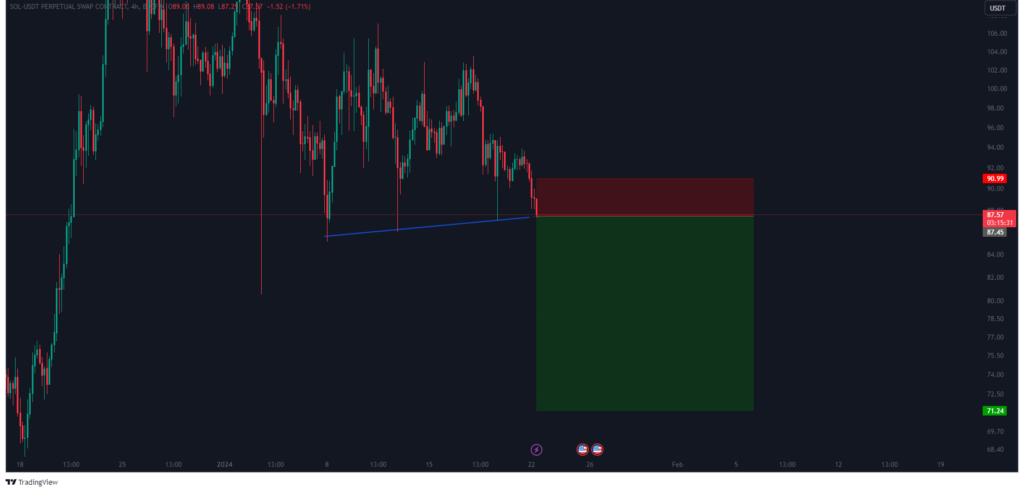
In response to this trend, analysts are now forecasting substantial declines in the valuation of SOL in the coming days. While there may be a temptation to initiate a long position at present, anticipating a rebound from the current support level, it’s noteworthy that the preceding rebound lacked the strength to sustain the overall trend.
The expectation is a subsequent decline, potentially retracing to $71, as per X post by cryptocurrency analyst Tryrex on January 22.
“It might be tempting to open a long right now and expect a bounce on this support level. However, the previous bounce was too weak to maintain the trend. I am betting on a crash back down to $71.”
Other analysts are bearish as well
With Solana’s current outlook and technical indicators not promising, other analysts shared their thoughts on the next support level and how many dips SOL might endure.
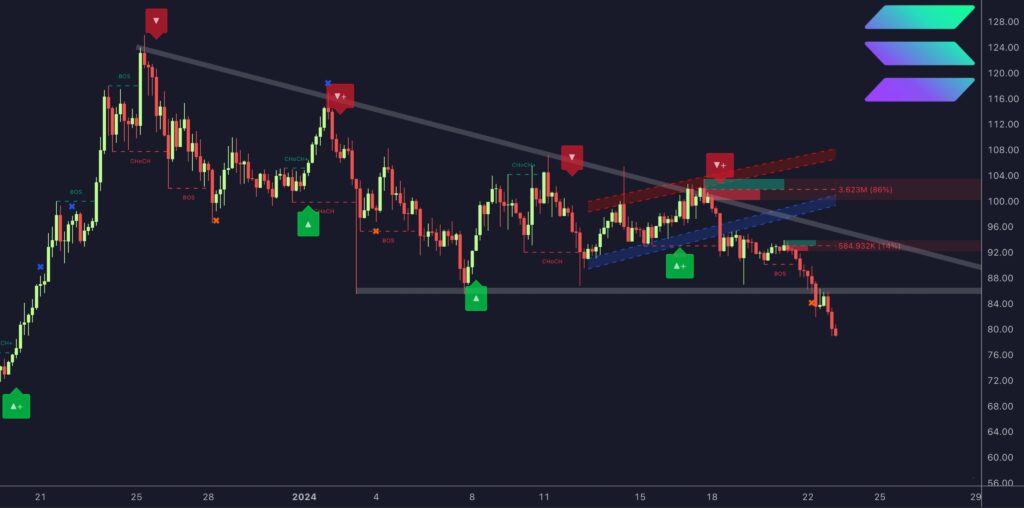
Looking at the previous trends and price movements of SOL, charts indicate that the parallel ascending channel is negated in the last period, which might suggest that further lows are on the horizon for this digital asset, as per a post from digital asset analyst LuxAlgo on January 23.
Upon examination of the daily chart, with a couple of hours until the candle concludes, there is observable downward movement below a significant support level. The green line denotes the subsequent support of interest, Dootr’s posted.
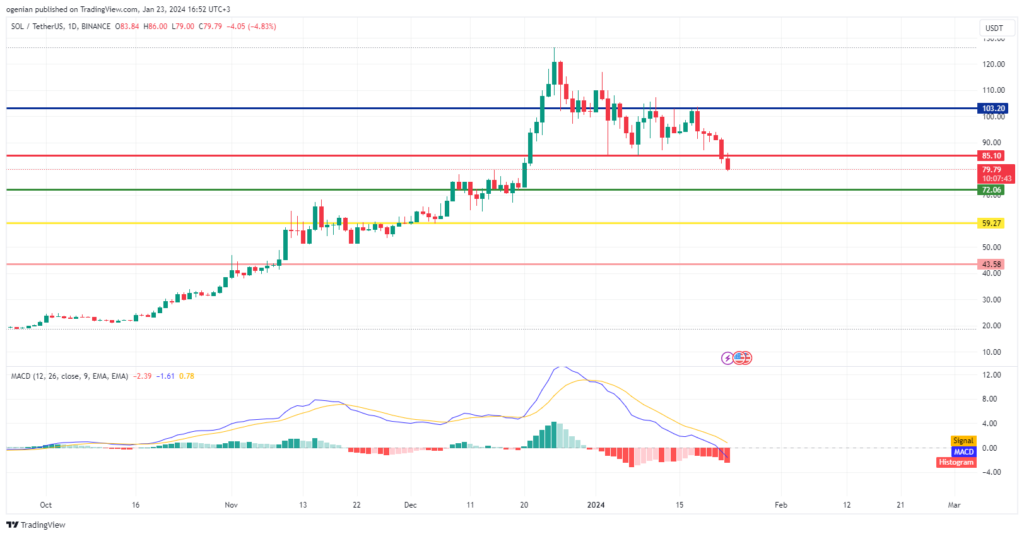
These three analysts seem to point towards the same conclusion that SOL might retrace its price to the next support level at around $70, where it faces a retest.
SOL price analysis
At the time of press, SOL was trading at $80.65, with a decline of -7.67% in the previous 24 hours, a loss of -15.78% in the last week, and a downside of -15.86% in the previous month.
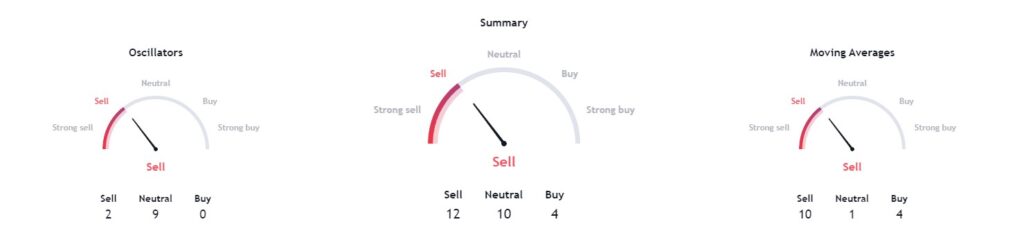
Expectedly, technical indicators signal a ‘sell’ at 12. With moving averages agreeing to a ‘sell’ at 10. And oscillators tilting towards a ‘sell’ as well at 2.
Only time can tell whether this downward spiral of SOL will reverse and this digital asset will accomplish another noteworthy year. Technical indicators, analysts, and performance currently spell out a bearish outcome.
Disclaimer: The content on this site should not be considered investment advice. Investing is speculative. When investing, your capital is at risk.