The stock price of semiconductor giant Nvidia (NASDAQ: NVDA) has recently approached the $110 mark after experiencing a sharp decline over the past week.
This drop follows a significant peak in mid-June, which marked a higher high at the top of a 20-month ascending channel. As of the close of markets on July 29, NVDA is valued at around $111, having decreased approximately 1.30% over the past 24 hours.
Despite recent fluctuations, NVDA shares are still up 126% for the year. However, the stock is now down more than 20% from its peak intraday price of $140.76, raising concerns among investors about the sustainability of its recent gains.
In this context, analyst TradingShot highlighted in a TradingView post that the stock would soon reach $110, advising investors to closely monitor NVDA as it approaches this strategic buying opportunity.
NVDA stock technical analysis and insights
According to TradingShot’s analysis of the daily chart, NVDA has been trading within a well-defined upward channel for the past 20 months, indicating a strong bullish trend. The mid-June peak, which reached a higher high at the upper boundary of this channel, suggested significant bullish momentum.
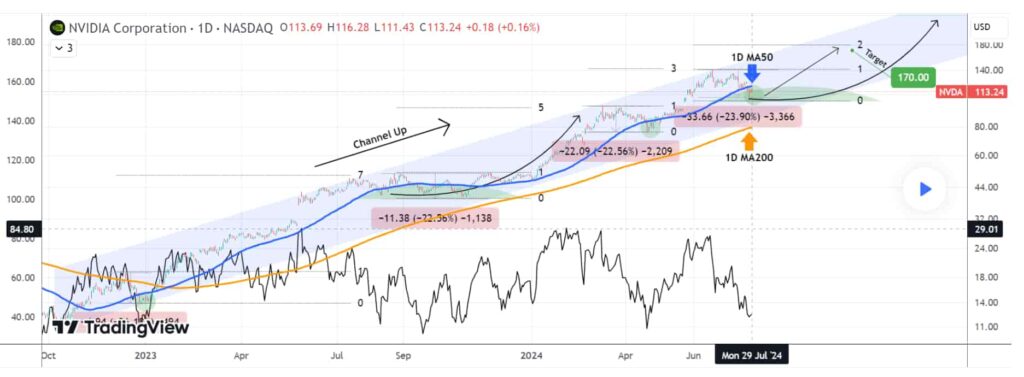
The 50-day moving average is a critical short-term trend indicator. Historically, NVDA becomes an attractive buy when its price dips below this moving average. Currently, the stock is approaching this level, signaling a potential buying opportunity.
The chart also shows past bearish legs with declines of at least 22.56%. Current downtrend suggests that NVDA might extend its losses to these levels before a reversal, indicating that the stock is forming a new bearish leg and moving toward the lower boundary of the price channel.
Similarly, on the weekly chart, the 50-week moving average serves as a long-term support level. NVDA has consistently stayed above this moving average.
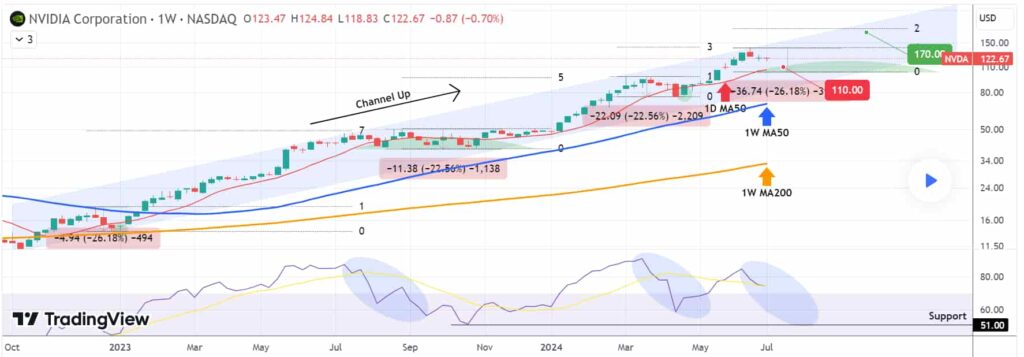
The chart also indicates a 2.0 Fibonacci extension at $170, suggesting this as a future price target. Each higher high in NVDA’s price aligns with a lower Fibonacci extension level, reinforcing the validity of this target.
Historical patterns show that NVDA’s bearish legs extend significantly. The current leg is expected to reach around $110, offering a strategic entry point.
Key levels to monitor
The key support levels for NVDA include the 50-day moving average at $113, which serves as a critical short-term support level for entry points.
Additionally, the 1-day relative strength index (RSI) below 40 historically marks the top of the long-term buy zone within the channel-up pattern. On the resistance side, the upper price channel boundary represents the upper limit of the long-term bullish channel.
The Fibonacci extension at $170 is another key level to watch as the price approaches higher targets. A break below the 200-day moving average would indicate a long-term bearish reversal.
In conclusion, the upcoming earnings report will be critical for NVDA as the company seeks to address investor concerns regarding the longevity of the current surge in chip sales.
Analysts from Goldman Sachs (NYSE: GS) anticipate that Nvidia will focus on demonstrating the return on investment (ROI) their customers achieve from using their graphics cards, aiming to reassure investors that the recent surge in demand is a sustainable trend rather than a temporary buying spree.
This could potentially reverse the current downtrend and provide a clearer outlook for Nvidia’s future performance.
Investors should closely monitor NVDA as it approaches the $110 mark, a strategic buying opportunity. The target price of $170 offers significant upside potential, grounded in historical price patterns and Fibonacci extension projections.
These insights, based on technical analysis, can help investors make informed decisions and capitalize on potential price movements in Nvidia.
Disclaimer: The content on this site should not be considered investment advice. Investing is speculative. When investing, your capital is at risk.