
As a consequence of regulatory pressure with the ongoing legal dispute between the Securities and Exchange Commission (SEC) and Ripple Labs, XRP was unable to capitalize on the 2024 cryptocurrency market rally, failing to achieve meaningful growth regardless of numerous breakout attempts.
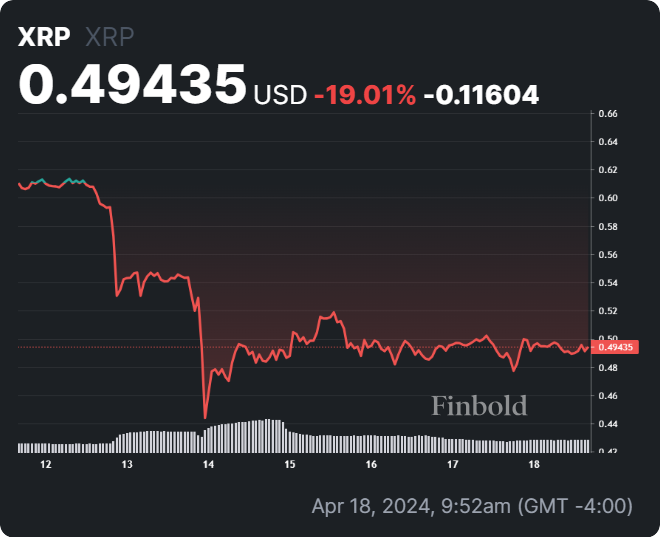
As of April 18, XRP price today hovers around $0.494, up by approximately 0.47% over the past 24 hours.
However, this marginal gain is offset by the fact that the token has lost a considerable amount from of value from its market cap over the last seven days falling from above $33 billion to below $28 billion as its price decreased by 19.01% in the last week.
Picks for you
This recent downturn has pushed the token’s market capitalization to $27.270 billion, at the time of publication.
Meanwhile, the cryptocurrency expert, known as CoinsKid, expressed a bearish view around XRP on April 17.
The analyst argues that XRP’s recent price movement suggests a failed bullish breakout transitioning into a potential significant decline, further pointing to the absence of a new price peak during the attempted upswing and the presence of a new price bottom during the recent dip as evidence supporting a bearish outlook.

Key XRP levels to watch
The current XRP trading situation represents a critical point, as the cryptocurrency confronts key support and resistance levels. The immediate support level is identified at $0.438, followed by a more optimistic resistance level at $0.550.
According to predictions from artificial intelligence (AI) machine algorithm models, XRP is expected to see a bearish trend in the long term, suggesting a projected decrease of 12.55%, with a target price of $0.432 by May 1.

In the short term, machine learning algorithms detect a bearish trend, indicating a potential slight increase in the next few hours.
The algorithms that deploy technical analysis (TA) indicators like relative strength index (RSI), moving average convergence divergence (MACD), Bollinger Bands (BB), average true range (ATR), and others.
Likewise, looking at the technical indicators spells out a bearish sentiment with an overall ‘sell’ rating. Moving average (MA), along with oscillators, point toward a ‘strong buy.’

Based on any of the three time frames, moving averages rate XRP as a ‘strong sell’, while the oscillators are generally reading ‘sell’ though they do flip to ‘neutral’ when the analysis is based on the last 4 hours of trading.
Disclaimer: The content on this site should not be considered investment advice. Investing is speculative. When investing, your capital is at risk.