With January bringing a mixed bag of gains and losses for the cryptocurrency market, Solana (SOL) has held steady and established a new support zone that could propel it toward its previously all-time high levels.
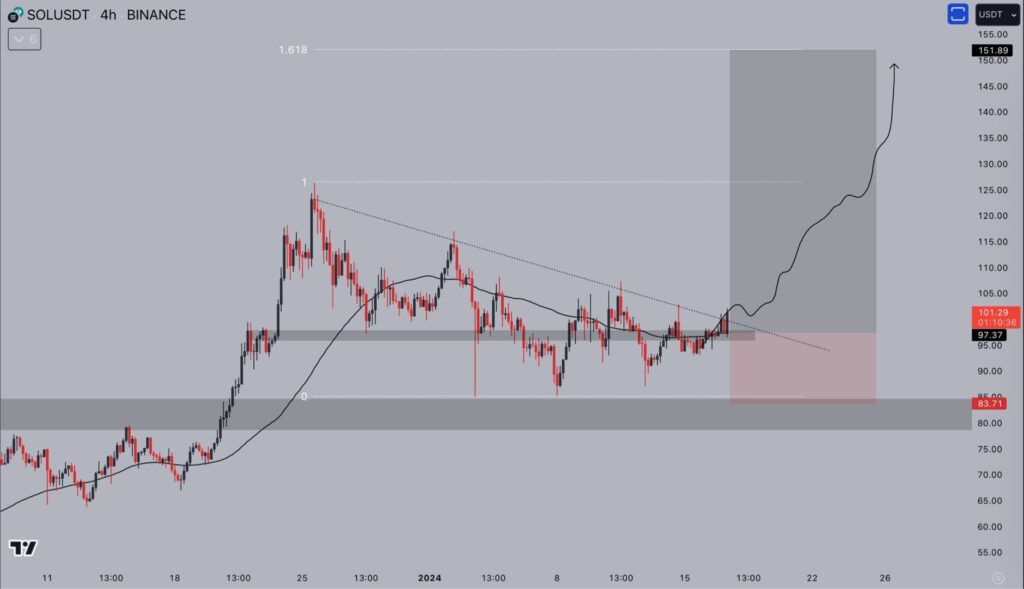
Solana experienced a breakout from a bull flag formation, which is evident on the 4-hour chart. A sustained closure above the $106 threshold could initiate a significant 47% rally, propelling the SOL token toward the price range of $150 to $165, which crypto analyst Ali Martinez reminded investors of in his post on X on January 16, suggesting it is only a matter of time ‘tick-tock.’
Per the expert, it seems that technical and fundamental indicators are tilting towards Solana’s continued gains, which look set to extend into the following months of 2024.
Analysts and indicators concur
With the decisive accumulation phase at the $100 threshold for Solana, it seems that this digital asset is gearing up for a substantial surge in the future.
Despite another rejection, there are indications that SOL is poised for an imminent breakout. The prospects for February appear promising, according to cryptocurrency expert Jelle’s post on January 17.
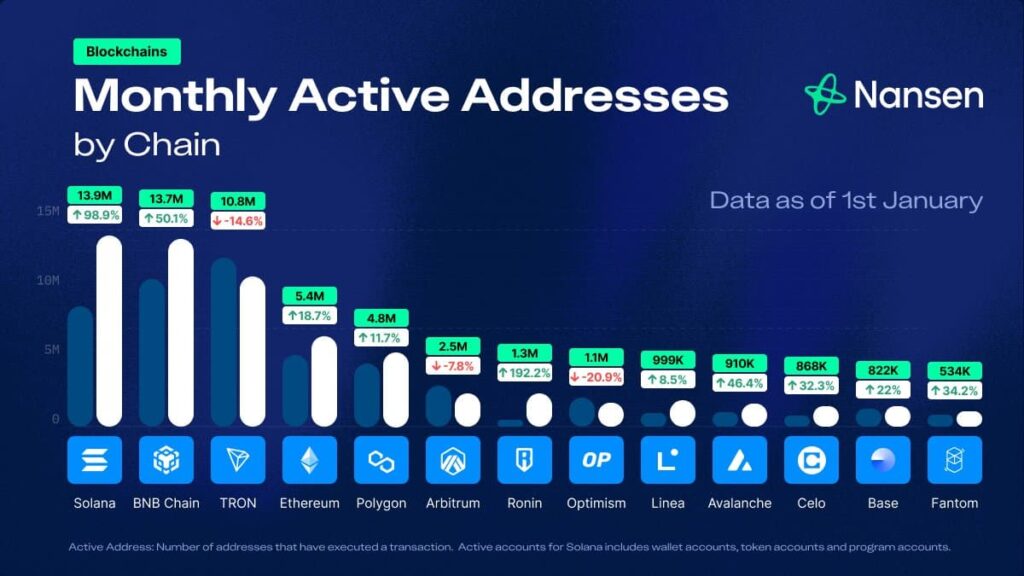
Furthermore, in December, the blockchain platform Solana demonstrated remarkable performance by surpassing all other chains in monthly active addresses, registering an impressive 98% surge, as reported by Nansen on January 1.
With significant backing from users and strong technicals, Solana displays most indicators analysts look for when predicting potential price movements.
Solana price analysis
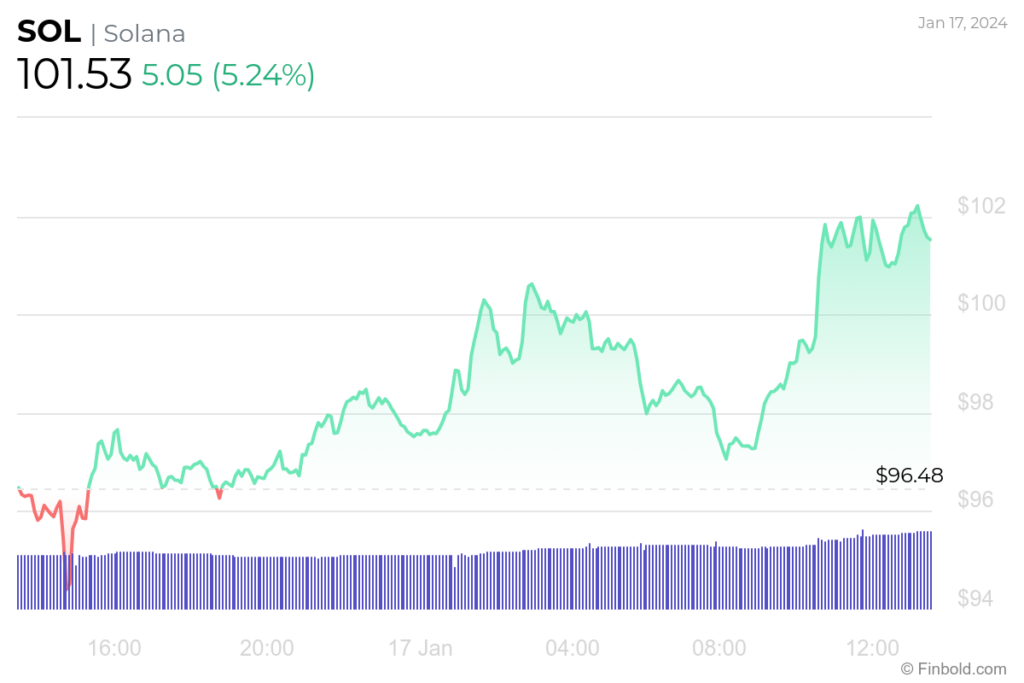
At the time of press, Solana is trading at $101.45, with an increase of 5.15% in the last 24 hours, while also gaining 7.61% in the previous week and 40.78% in the last 30 days.
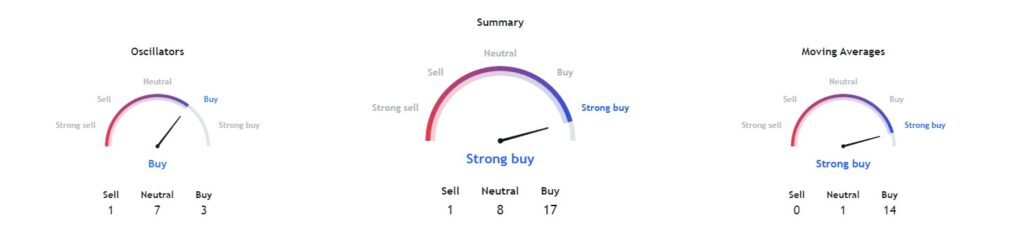
Technical indicators are bullish on Solana, as they move towards a ‘strong buy’ at 17 while moving averages agree with a ‘strong buy’ at 14. Oscillators portray a ‘buy’ signal at 3.
With all the indicators working in Solana’s favor, it remains to be seen whether this crypto can attain the threshold of $150 and then move toward $200, potentially surpassing its all-time high.
Disclaimer: The content on this site should not be considered investment advice. Investing is speculative. When investing, your capital is at risk.