After a surge in popularity of meme coins in March, cryptocurrencies have seen a notable price decline over the past week.
In particular, Shiba Inu (SHIB) has been following a downward trajectory, trading below previously solid support levels.
Despite a decline of approximately 18.96% over the past week, bringing the price of SHIB to around $0.000023 as of April 19, there has been a recent upswing. From its lowest level of $11.36 billion on April 13, Shiba Inu has displayed resilience, reclaiming some lost ground over the past five days.
Picks for you
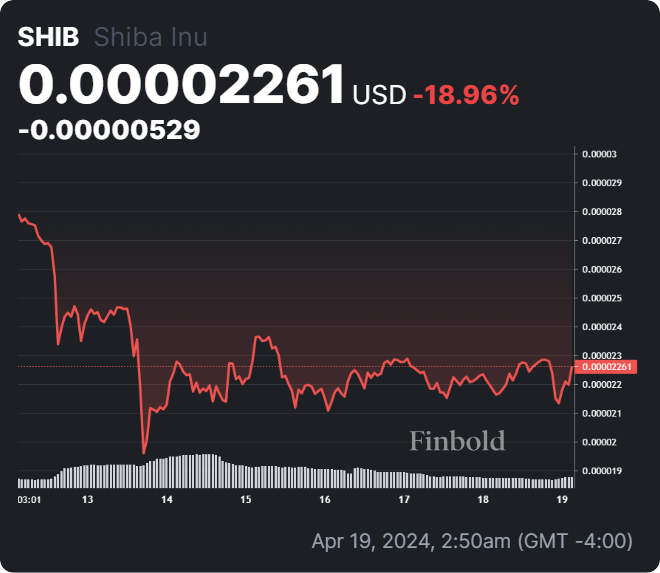
In the last 24 hours, the price has climbed nearly 4%; however, this slight improvement is balanced by the fact that SHIB’s market capitalization has experienced a notable decline over the last week decreasing from over $16 billion to approximately $13 billion.
Key SHIB levels to watch
Currently, Shiba Inu is trading around the support level of $0.000023. To keep climbing, the token needs to overcome resistance at $0.00003.
While machine learning algorithms suggest a neutral trend in the short term, with a slight chance of increase or decrease in the next few hours, the long-term forecast appears bearish.
Artificial intelligence (AI) machine algorithm models on April 19 predict a potential 4.35% decrease for the token by the end of the month, bringing the price of SHIB down to around $0.000022 by May 1.
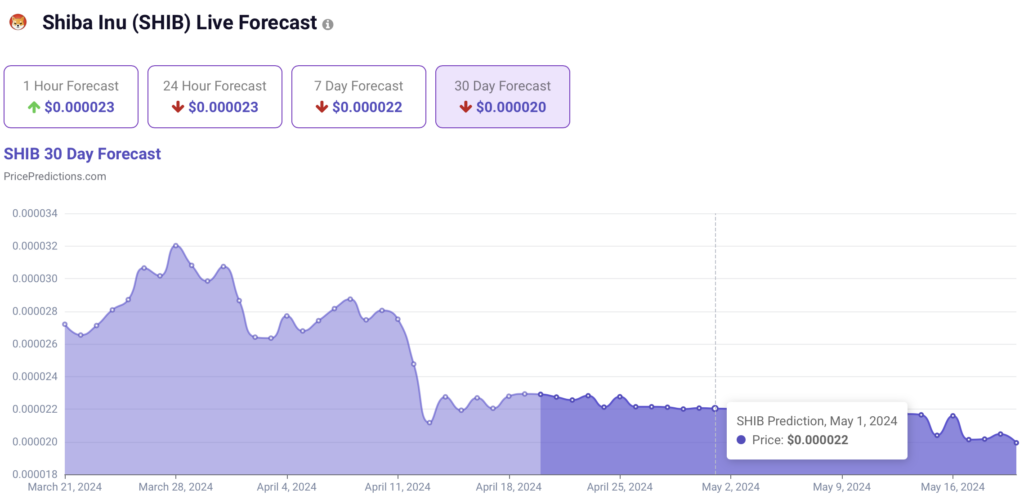
These predictions are based on technical analysis (TA) indicators like relative strength index (RSI), moving average convergence divergence (MACD), Bollinger Bands (BB), average true range (ATR), and others.
SHIB technical indicators
The summary of Shiba Inu, founded on any of the most popular technical indicators such as moving averages, oscillators, and pivots, represents a diverse outlook.
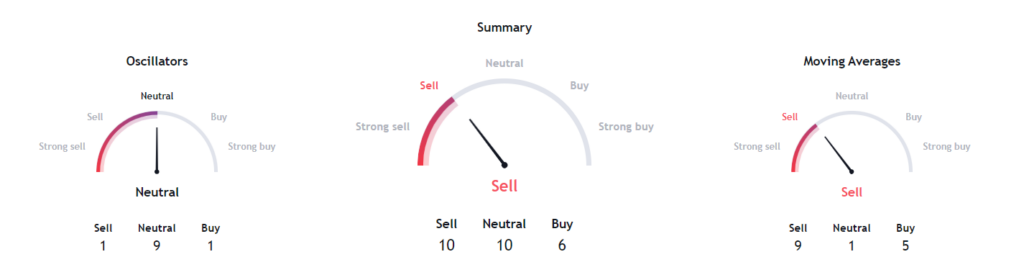
Looking at the last 24 hours, moving averages suggest selling, while oscillators lean towards neutrality. However, on the one-week timeframe, the trend flips. Moving averages now indicate a buy signal, while oscillators remain neutral.
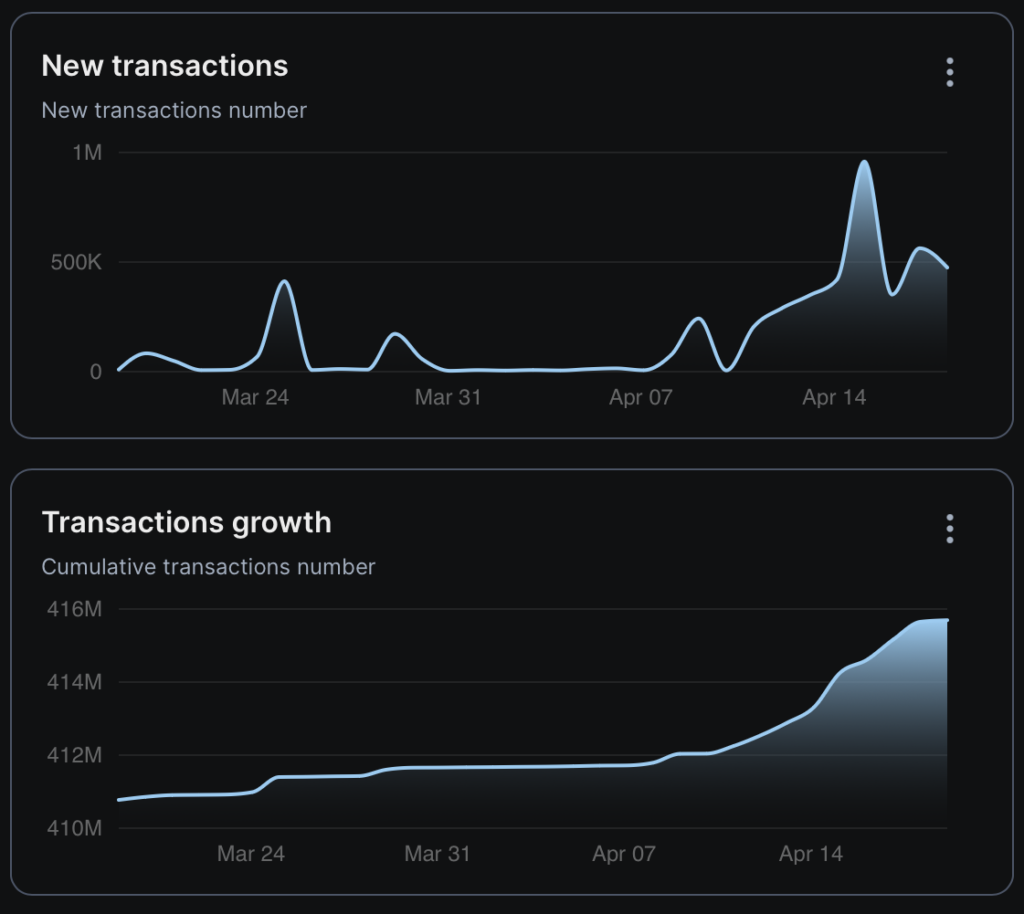
Shibarium transaction numbers
According to data from Shibariumscan, new transactions on the Ethereum Layer-2 scaling solution have reached 475,0292 as of press time. However, this figure still falls significantly short of the peak of 958,500 transactions that Shibarium previously recorded, before experiencing a substantial drop of 63.2% three days ago.
Nevertheless, this positive development aligns with historical trends, suggesting the possibility of future price increase, and coincides with recent gains observed in SHIB and BONE tokens.
All in all, the long-term sustainability of this recovery remains to be seen.
Disclaimer: The content on this site should not be considered investment advice. Investing is speculative. When investing, your capital is at risk.